TBA Trading Volume
Trading volume was relatively flat week over week. The only real gain was in GNMA trades which were up 7.3% week over week.
Conv 30yr trades were 5 times the amount of GNMA 30yr so the small increase in activity on the GNMA product wasn’t enough to make a significant impact overall. Coupon concentration on the Conv 30yr trades shifted back in the 3.5 – 4.5 range this week after moving down half a coupon last week. Concentration in coupon stack remained consistent for the other products. Conv 15yrs primarily trading in the 3s & 3.5s. GNMA 30yrs trading in the 3.5 – 4.5 range.
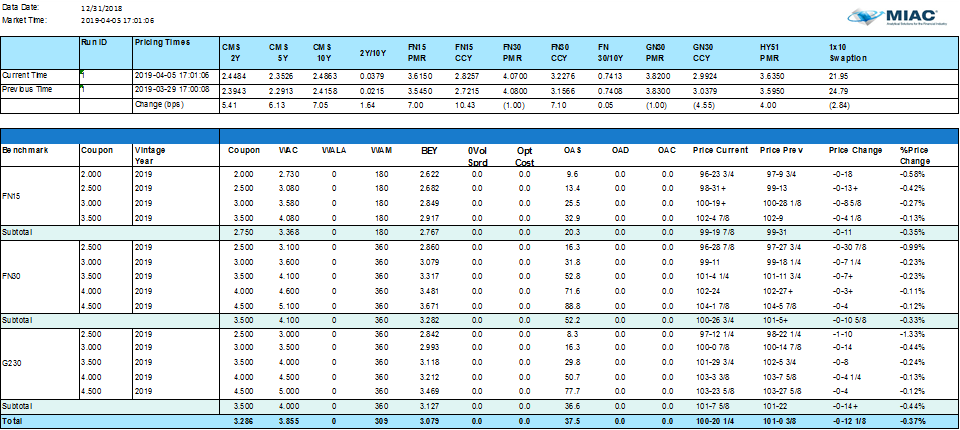
Figure 1: Period-Over-Period Price Change by Benchmark, Coupon and Vintage Year Source: MIAC Analytics™
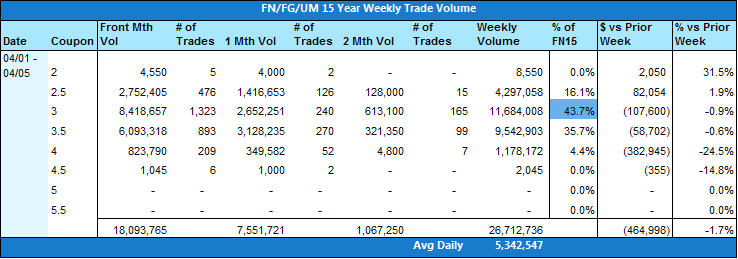

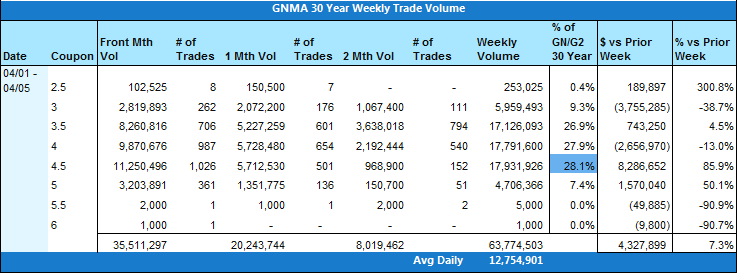
Figure 2: Weekly Trade Volume Source: MIAC Analytics™
The yield curve steepened last week as Treasury markets rose on the back of mixed data and improved trade negotiation talks between the U.S. and China. The 2-10 spread widened to 15 and 10-Yr yields ended higher at 2.497. The primary/secondary spread ended the week at 90 after hitting a 6-month high of 112 on 3/25/2019. FN30 3’s grossly outperformed G230 3’s week-over-week with FN30 3.5 and 4 only modestly outperforming G230 and very little movement in the higher coupons. Based on the price movement we have seen over the past few weeks it’s not surprising that March 30-Yr prepayment speeds were up 25% in Fannies, 24% in Golds, and 22% in G230’s.
Mortgage applications rose for another straight week at 18% with refinances up 38%. Freddie Mac’s average 30-Yr Fixed Rate Mortgage was close to unchanged from the week before coming in at 4.08%. This week brings CPI where investors will be watching to see if cooling wage pressures are evident in this next reading. March FOMC minutes will be released on Wednesday where we should receive more detail on what conditions could cause the next rate move. The big unknown that still lingers is what a no-deal Brexit will mean to markets as EU economies run the risk of being hit hard if no deal is reached. Brexit was postponed from March 29 to April 12, so we could see interesting price movement at the end of this week and beginning of next.
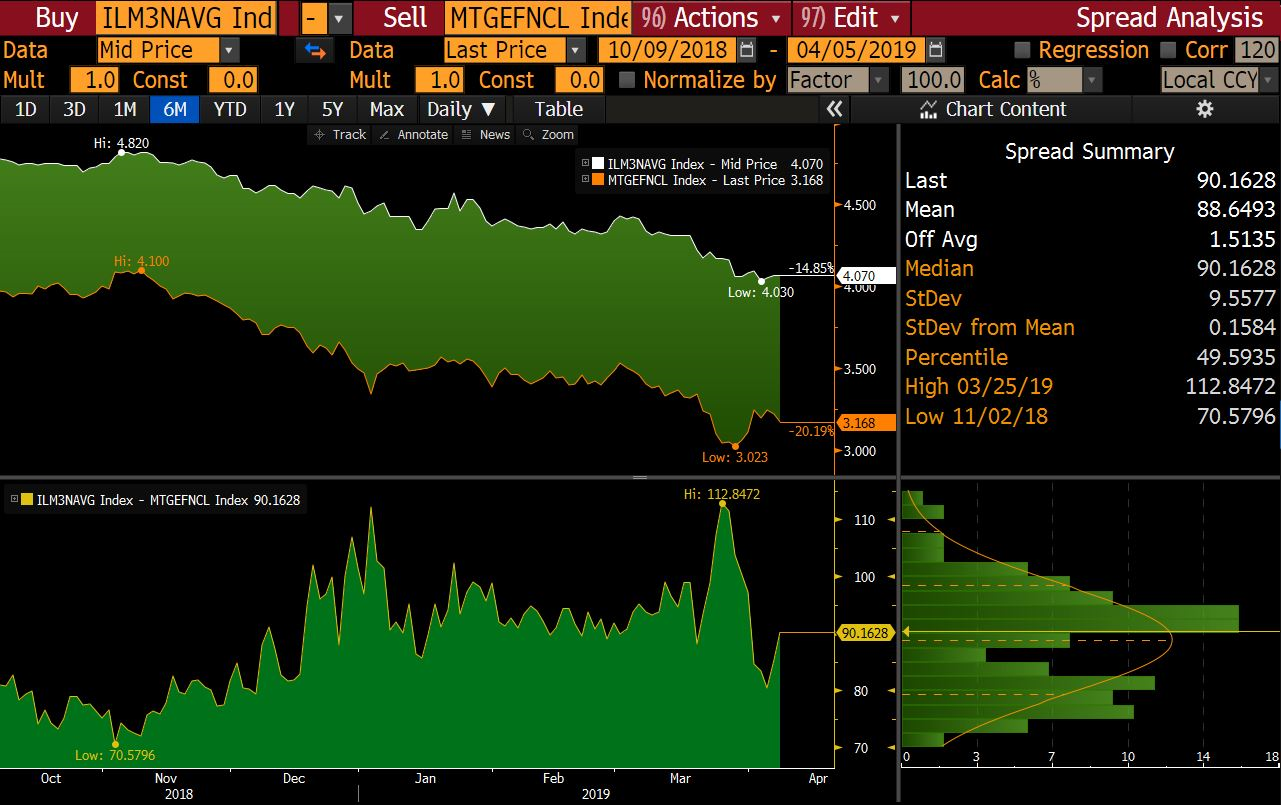
Figure 3: Primary/Secondary Spread Source: MIAC Analytics™
Mortgage Applications
Mortgage application volume increased 18% last week from a week earlier as refinances lead the charge. The MBA Refinance Index rose 38% week over week to 1786 (the highest since 2016 and 38% above the Jan. 2018 level). Conventional refinances were up 36% (highest since 2016), VA refinances were up 46%, and FHA refinances up 25%. After a rough 2018, lower rates are a welcome sight to most lenders who have been dealing with a cooling housing market. Rates sit at the same levels they did last January. Many analysts feel that rates would need to fall by another 50 bps to keep refinance volume elevated through the second quarter.
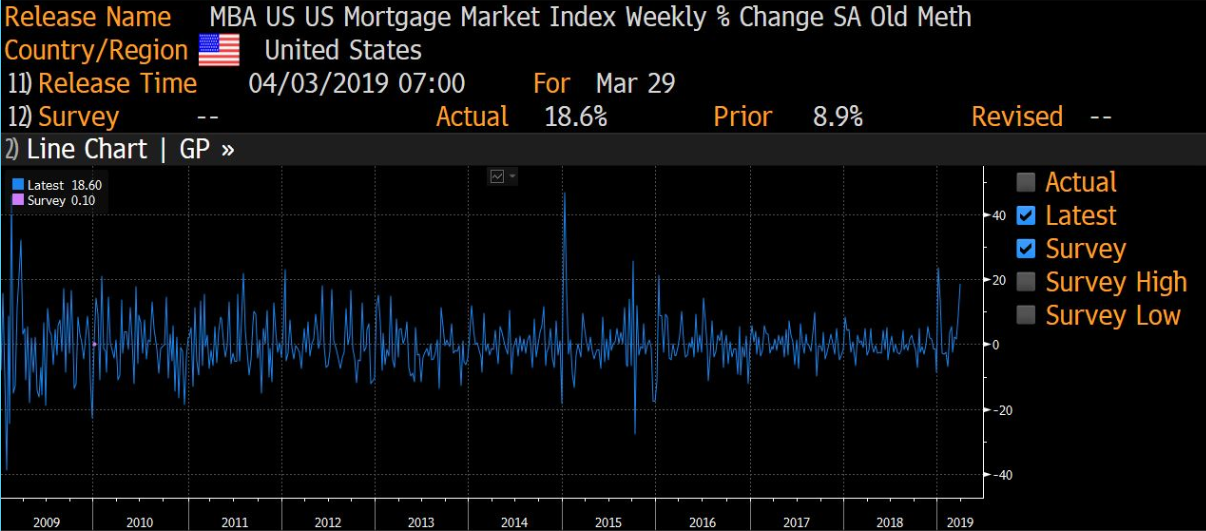
Figure 4: Mortgage applications were up another week as rates bottom out Source: Bloomberg
Economic Data
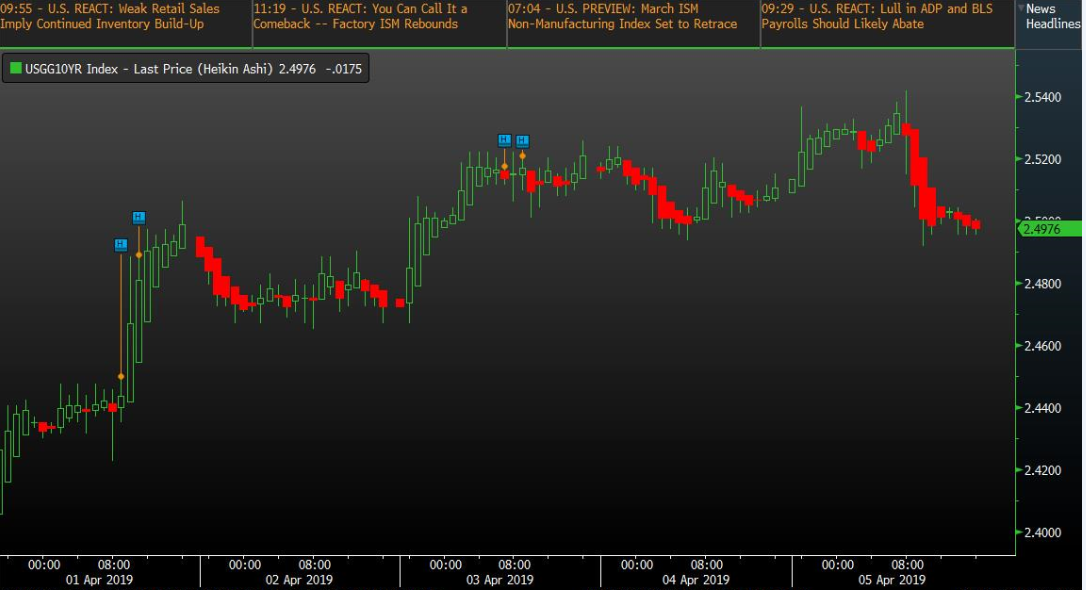
Figure 5: 10-Yr movement as data is released each day Source: Bloomberg
Monday, April 1st
-
ISM Manufacturing came in at 55.3 vs. expectations of 54.5. Prices paid increased to 54.3 and February construction spending beat forecasts at 1.0% MoM vs. expectations of -0.1% (January revised upwards from 1.3% to 2.5%).
Tuesday, April 2nd
-
Durable Goods came in at -1.6% vs. expectations of -1.8%. Non-defense Ex Air was the second lowest since July 2017 at -1.9%.
Wednesday, April 3rd
-
ISM Non-Manufacturing came in at the lowest reading in 20 months at 56.1 vs. forecasts of 58. ADP National Employment came in at 129k while consensus was for 175k (February revised upwards from 183k to 197k).
Thursday, April 4th
-
Jobless Claims fell to a 49 year low coming in at 202k vs. 215k (see chart below) and Continuing Claims came in at 1717k vs. 1752k.
Friday, April 5th
-
Average Earnings came in at +0.1 vs. 0.2. Private Payrolls +182k vs. +170k and Manufacturing Payrolls came in at -6 vs. 10 (previously revised from 4 to 1). Non-Farm Payrolls printed at +196k vs. 180k with prior month revisions of 20k to 33k. Average workweek hours and Unemployment Rate remained unchanged at 34.5 and 3.8.
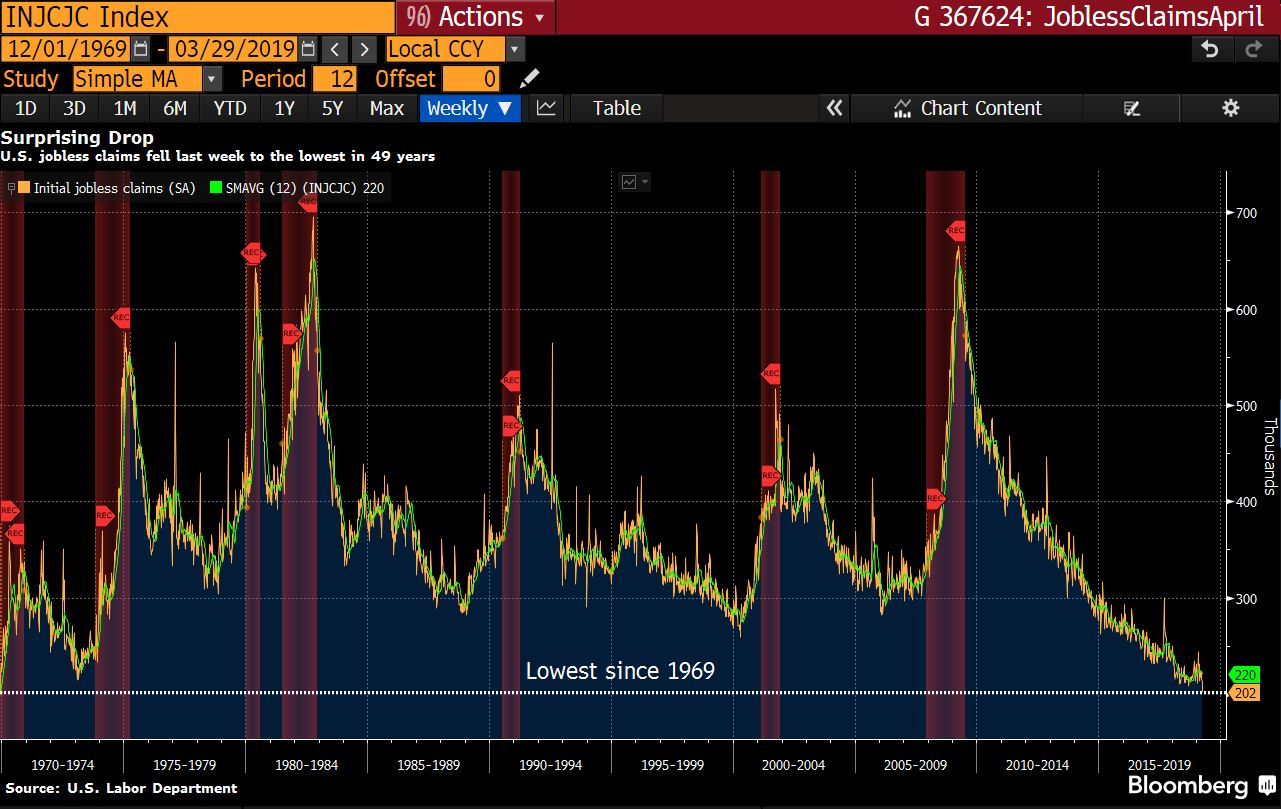
Figure 6: Jobless Claims lowest in 49 years Source: Bloomberg
Jobs Reports
Friday’s job reports were unexciting as Non-Farm Payrolls beat expectations at 196k vs. 180k and the previous month was revised up to 33k from 20k. Manufacturing Payrolls came in at -6 vs. expectations of +10 and Private Payrolls came in at +182k vs. 170k. Job growth over the past three months holds an average of 180k a month which is down from the average 223k a month last year. The Unemployment Rate held steady at 3.8% and average hourly earnings rose 3.2% from a year earlier. March’s jobs reports reinforce the Feds current stance that a rate cut is not currently in the cards.
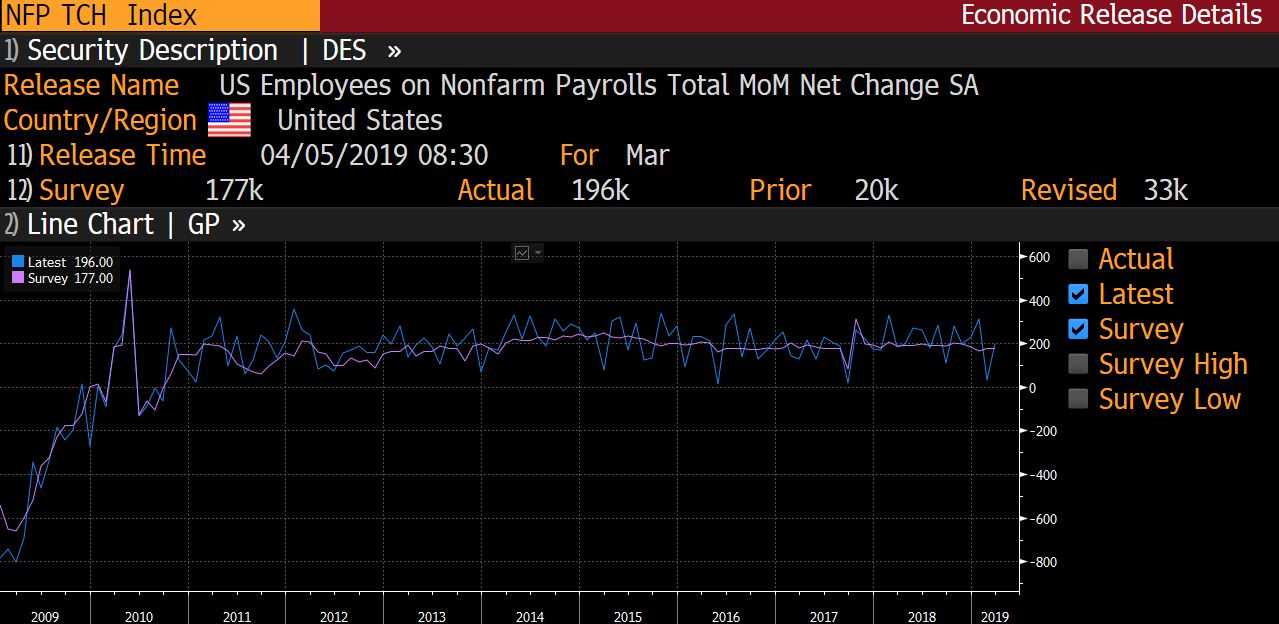
Figure 7: Non-Farm Payrolls beat expectations coming at +196k Source: Bloomberg
The Week Ahead
In the week ahead, inflation will be at the forefront of everyone’s minds as they look to the release of CPI to see if the lower Average Hourly Earnings reading from Friday can be seen in other economic areas. The market will also be closely watching the FOMC minutes release for additional insight into economic conditions. We will also be watching the market’s interest in this week’s Treasury auctions with the 10-Yr being at the top of the list. Other key data releases include MBA mortgage applications, Core Producer Prices, and Import and Export Prices.
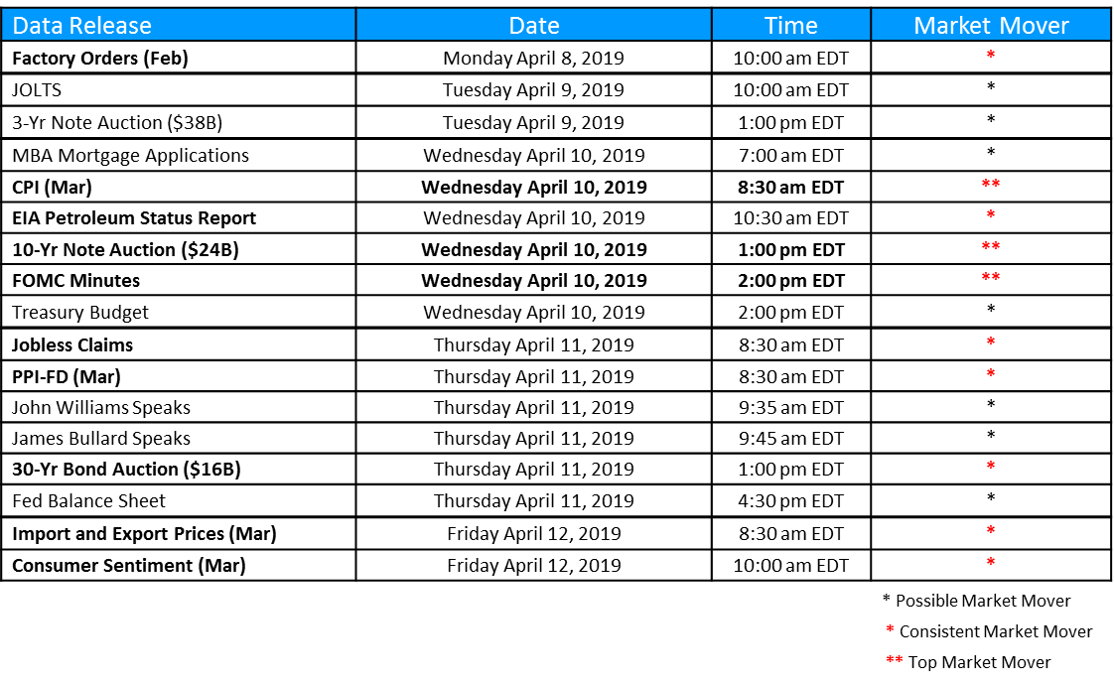
Figure 8: Weekly Data Releases Source: MIAC Analytics™
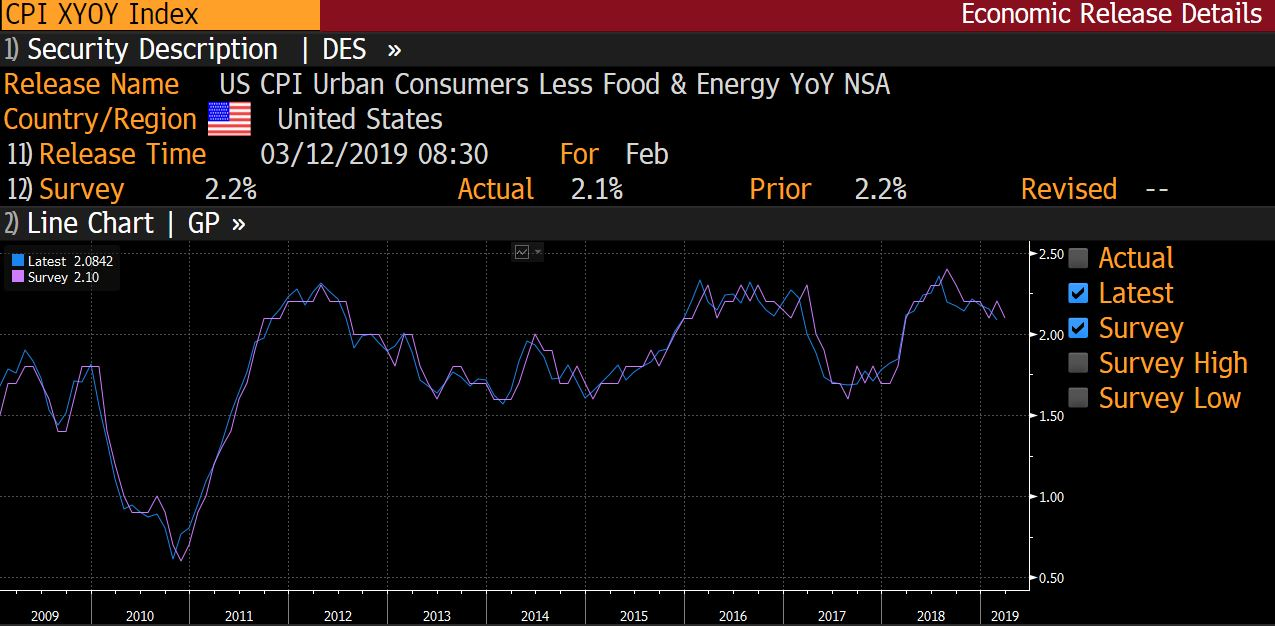
Figure 9: CPI Source: Bloomberg
.
.
Secondary Markets Commentary – Week of April 8, 2019
Author
Brad Eskridge, Managing Director, Secondary Solutions Group
Bradley.Eskridge@miacanalytics.com
Author
Justin Deaver, Account Manager, Secondary Solutions Group
Justin.Deaver@miacanalytics.com