Month-over-Month
From end-of-month August to end-of-month September, the MIAC Generic Servicing Assets, (GSAs™) Conv_30 Index increased by 3.53% and the GNII_FHA_30 index increased by 3.15%.
In larger GSA cohorts, which are actively traded in the MSR market, the Conv30_3.5_2016 cohort increased by 3.70% and the GNII_FHA30_3.5_2016 cohort increased by 3.23%. During the month of September, Conv_30 Index OAS’s tightened to close the month at 840.4 bps for a decrease of 22.0 bps. Likewise, GNII_FHA_30 Index OAS’s tightened to 1,031.1 bps for a month-over-month decrease of 29.6 bps.
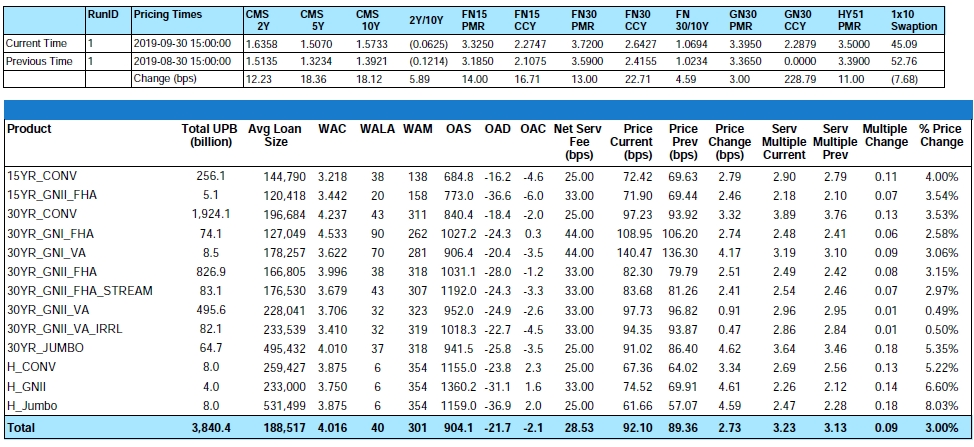
Figure 1: Month-over-Month Pricing Change by Product Source: MIAC Analytics™
Due to a whole medley of causes including but not limited to: 1) A gloomy month for manufacturing, 2) Ongoing anxiety about the impact of the US-China trade war, 3) Declines in Europe, and finally 4) Impeachment jitters, all year investors have flocked to the safety and stability of U.S. Treasuries, pushing down interest rates. Although mortgage rates remain significantly lower than where they were a year ago, let us temporarily rejoice in the knowledge that month over month rates backed off of their lows and as depicted in MIAC’s GSAs (See Figure 1), MSR values acted in kind.
From August to September MIAC’s Primary Mortgage Rate increased by (13) thirteen basis points to 3.72% and a rate that falls within a 10-bps range of commonly used primary mortgage rate benchmarks.
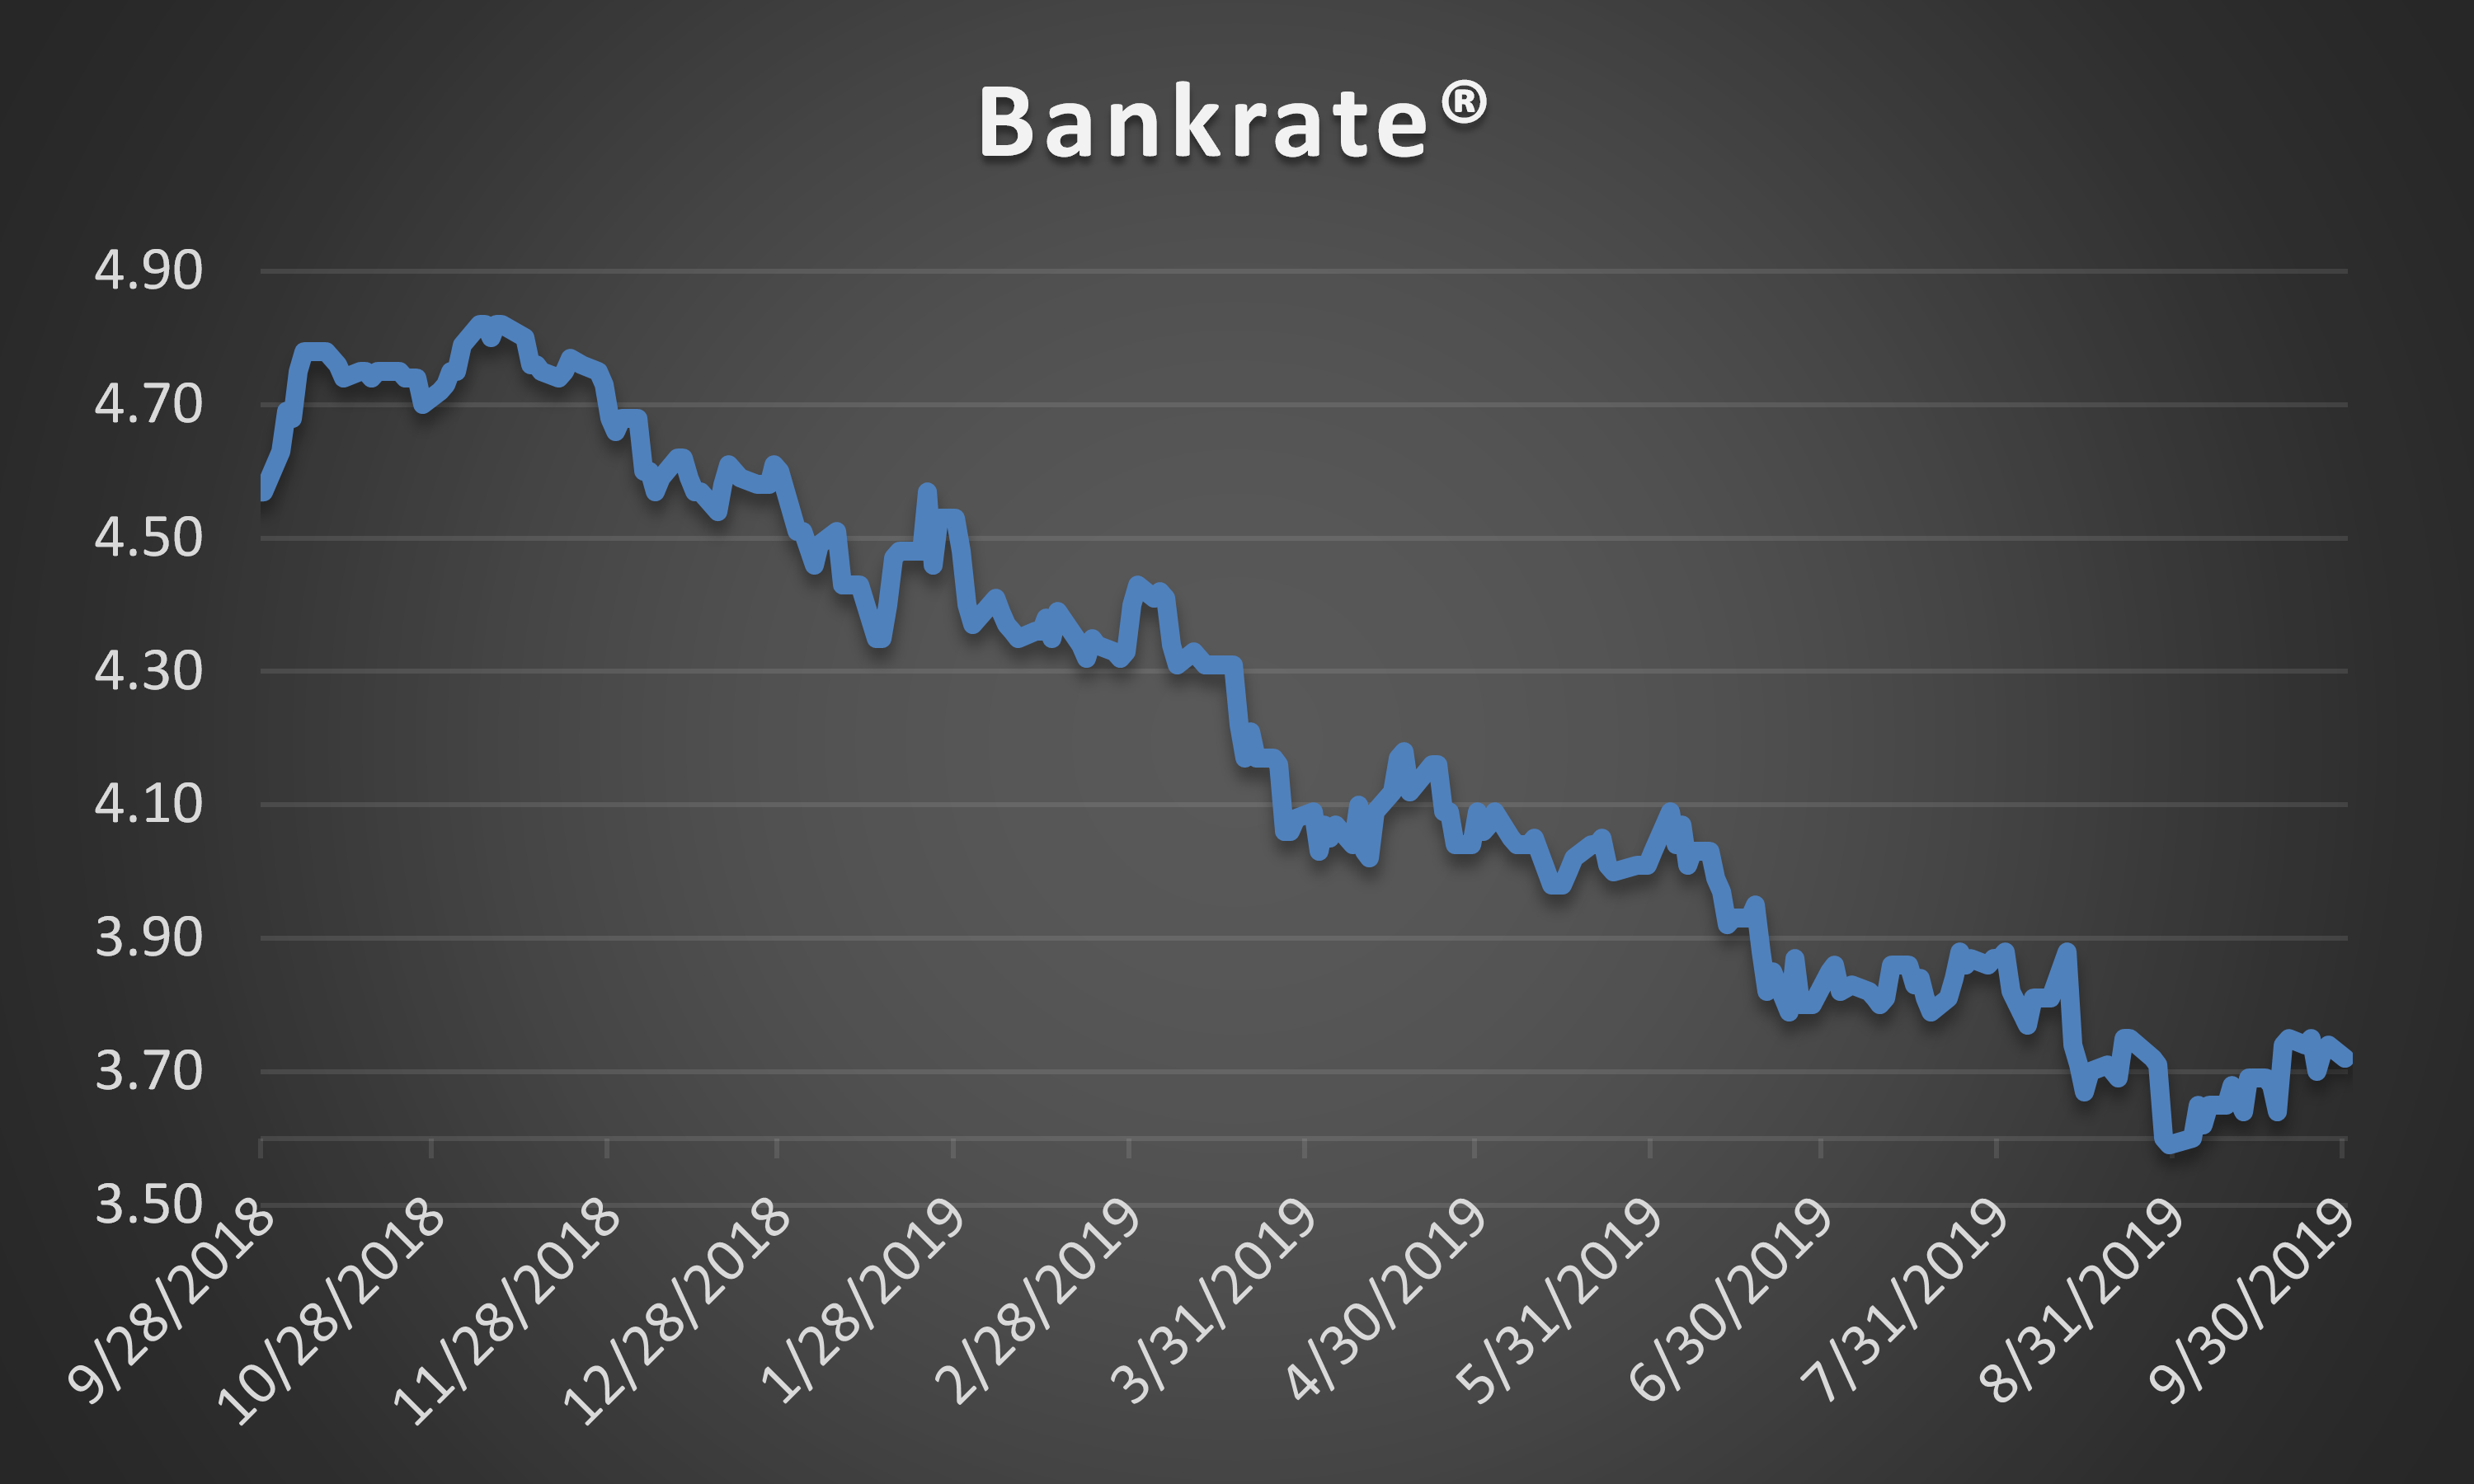
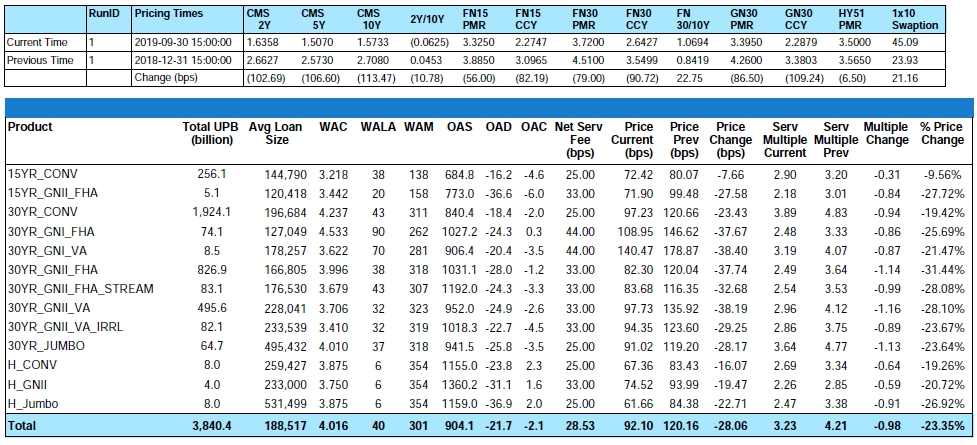
Figure 2: Year-to-Date Pricing Change by Product Source: MIAC Analytics™
Although higher in the month of September, lower rates in 2019 have translated into a stronger housing market with home sales and housing construction both showing improvement. As trade talks ebb and flow changes in rates follow yet despite all of the volatility, Freddie Mac, as reported in their September Economic and Housing Research Forecast expects the 30-year fixed-rate mortgage to average 3.7% in the fourth quarter of 2019 vs. an annual average of 3.8% in 2020. The MBA revised its latest 30-year fixed-rate mortgage estimate to 3.8%. On a more positive note, even though YTD MSR values are substantially lower, at least we have more of it to value. On the latest September forecast report, Freddie Mac revised its full-year origination forecast to $2.090 trillion and the MBA to $1.937 trillion. This is up from roughly $1.6 trillion in 2018.
Prepayment News
As a forecasting tool, the MBA refinance application index rarely lets us down and September was no exception. Despite a 10% decline in business days from August to September, conventional 30-year agency MBS prepayment speeds still managed an 11% increase from 17% to a 19% CPR. Newer vintage 2018 and 2019 vintage pools continue to prepay faster than more seasoned mortgages with 4.0% 2017 coupons prepaying at a 25% CPR vs. a 39% CPR for the 2018 vintage pools.
As compared to 30-year MBS cohorts, 15-year MBS cohorts have been prepaying at a slower pace. For example, 15-year MBS experienced a 24% CPR in aggregate for the 2018 vintage pools vs. a 34% CPR for the comparable 30-year MBS cohort. The cause – a typically lower average balance and reduced savings potential.
On a two-day-higher day count, expect prepayments to be flat to slightly up in October.
Recapture: To include or not
The conundrum for many in the Fair Market world right now is to include or not include recapture into a Fair Market Value. Per GAAP, the inclusion of recapture is strictly forbidden. The problem is this – per GAAP, it’s also a requirement to benchmark values to observed trades and to be competitive on deals of $5 billion and greater, for certain transactions it’s a virtual mandate that buyers directly or indirectly include recapture into their bid price in order to be competitive. Once it becomes an observed trade, also per GAAP, we’re to benchmark to those observed trades.
Just to lend some clarity to this discussion, a portfolio prepaying at 15% annually with a 1% gain on sale margin and a recapture rate of 20% can produce an additional 10 basis points in economic benefit or roughly 2.5 bps for every 5% of recapture recognized.
While ill-advised, to avoid detection, some will lower their discount rates and/or their CPRs to simulate the same desired outcome. They do this by reporting a CPR net of recapture. While not all large firms do so, it is the firms with $5 billion or greater in servicing that have the greatest tendency to include some form of recapture into their GAAP results. Given the availability of observed trades that include recapture, multiple audit firms are becoming increasingly receptive to its inclusion.
On the list of why firms might exercise some caution, there are only a limited number of buyers that regularly include recapture as part of their bid prices. If those buyers would stop buying or stop including recapture into their bid prices, it could leave anyone benchmarking to those trades exposed. As previously referenced, a firm may discontinue paying up for recapture when/if bandwidth creates more volume than a firm is equipped to handle. Anyone believing that their ability to recapture may be compromised due to capacity constraints is not likely to include as much or any recapture benefit into their bid prices.
For anyone contemplating direct or indirect inclusion of recapture into a Fair Market value, it’s wise that they first approach their auditors with a detailed history in support of their actual recapture experience and be able to defend those results against recent benchmark trades.
MSR Transaction Activity
In the last two months, there have been a number of noteworthy offerings. Topping the list of sellers were mostly medium to larger size non-banks. In no certain order the deals of interest were as follows:
1) $10.9 Billion FN/FH, 38.4 Service Fee, $370k Average Balance, 4.29% WAC, 2 WALA.
2) $8.1 Billion FN/FH, 27.9 Service Fee, $238.1k Average Balance, 3.867% WAC, 37 WALA.
3) $13.8 Billion GNMA, 37.3 Service Fee, $202.5k Average Balance, 3.70% WAC, 41 WALA, 8% 30+.
4) $8.4 Billion, FN/FH, 25 Service Fee, $226.7k Average Balance, 3.921% WAC, 27 WALA, 0% 30+.
5) $7.9 Billion FN/FH, 25 Service Fee, $301.9k Average Balance, 3.918% WAC, 1 WALA, 0% 30+.
Other notable deals included a $45 Billion Private Label Servicing transaction, a $1.5 Billion FN/FH deal and an $11.9 Billion GNMA deal that bids this week. Recapture seems to be the name of the game particularly the larger Agency trades. Buyers are showing a willingness to incorporate into their bid prices recapture rates that on average are around 20% at an approximate gain on sale margin of 1%. At a hypothetical lifetime CPR of 15%, this can influence a bid price by approximately 10 bps. Still, sellers should exercise some caution as smaller deal sizes and/or bandwidth constraints can dramatically influence how much if any recapture benefit makes its way into a buyer offering price.
“Large” transactions which we define as deals containing $1 to $5 plus billion in unpaid principal balance continue to validate our very granular GSA prices. As for smaller offerings, the price/multiple spread initially tightened but depending on the trade and amount of buy-side interest is now showing some signs of widening. This is largely due to differences in the amount of recapture benefit being included in a buyer offering price.
The smallest packages categorized as $300 million or less in unpaid principal balance are trading but at prices that “on average” range anywhere from 10 to 20 bps lower than the bid prices obtained on larger offerings. In addition to the reduced economies of scale afforded by larger MSR trades, the acquisition cost is one of the reasons that smaller deals can trade at a discount to larger offerings. The legal and due diligence cost that a buyer typically incurs to acquire a portfolio can influence how a firm might bid on a smaller trade. Even so, it is the smaller trades that can often create the largest margins and in a quest for margin, increasingly we see larger buyers bidding on smaller offerings but usually with a more rigid approach to price and term negotiations.
Regardless of size, not all bids are as they might appear on the surface. Differences in prepay protection periods, non-reimbursable advances, non-payment for assets that are 60 or more days delinquent, fee deducts for seriously delinquent MSRs, loan kicks, seller non-solicitation requirements, and possible set-up fees are just a few of the pitfalls that can quickly affect a seller’s net execution price.
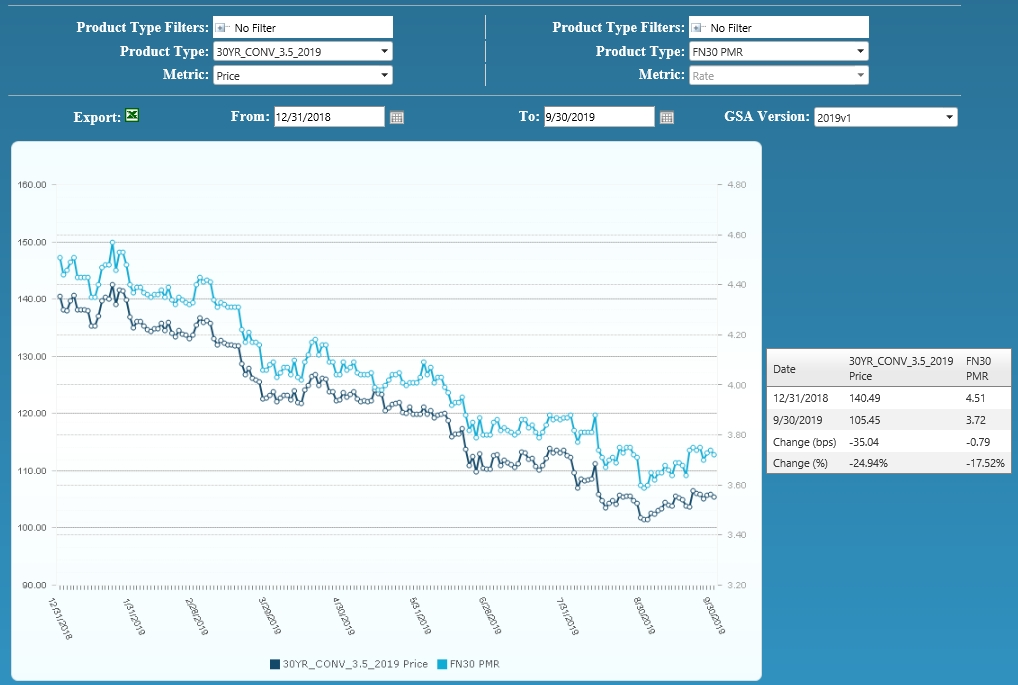
Figure 3: Year-to-Date Conv 30-YR 3.50% 2019 GSA Index Source: MIAC Analytics™
MIAC’s MSR Valuation department provides MSR valuation advisory services to over 200 institutions totaling nearly $2 trillion in residential and commercial MSR valuations every month.
.
Residential MSR Market Update – September 2019
Author
Mike Carnes, Managing Director, MSR Valuations, Capital Markets Group