Month-over-Month
From end-of-month September to end-of-month October, the MIAC Generic Servicing Assets, (GSAs™) Conv_30 Index increased by 3.16% and the GNII_FHA_30 index increased by 2.99%.
In larger GSA cohorts, which are actively traded in the MSR market, the Conv30_3.5_2016 and GNII_FHA30_3.5_2016 cohorts respectively increased by 3.61% and 3.17%. During the month of October, Conv_30 Index OAS’s further tightened to close the month at 575.3 bps for a decrease of 11.3 bps. Conversely, GNII_FHA_30 Index OAS’s widened to 694.4 bps for a month-over-month increase of 20.2 bps. Year-to-date Conv_30 Index OAS’s are tighter by a full 220.7 bps and GNII_FHA_30 Index OAS’s are tighter by an impressive 299.6 bps.
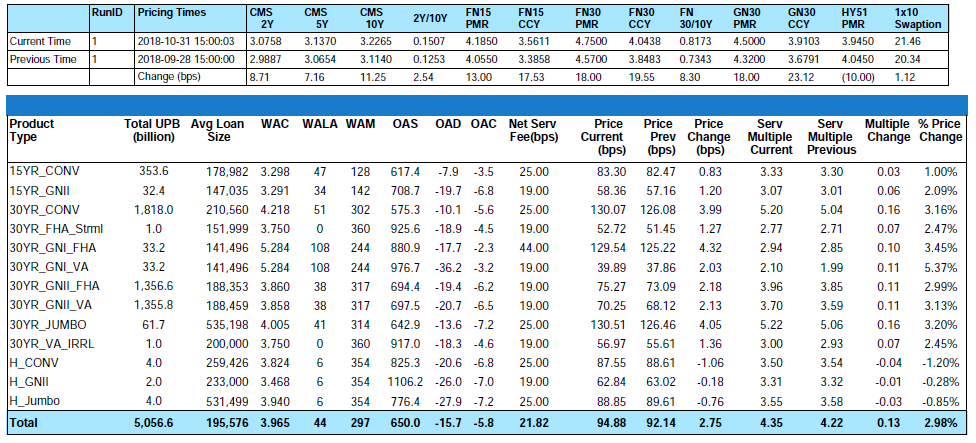
Figure 1: Month-over-Month Price Change by Product Source: MIAC Analytics

Figure 2: Year-to-Date Price Change by Product Source: MIAC Analytics
From end-of-month September to end-of-month October, primary rates as reported by Bankrate® increased by eighteen (18) basis points. Through end-of-month October this month’s back-up means that year-to-date 30-Yr conventional primary rates are now higher by a full ninety (90) basis points. The back-up also resulted in a newly updated MBA end-of-year 30-Year Fixed Rate Mortgage Rate projection of 4.90% which is up a full 20 basis points from just one month prior.
Refinance Volume and its Impact on CPR’s
With higher interest rates come lower refinance volumes. So low in fact that that the MBA application index is currently at an 18-year low with refinance volume accounting for an estimated 28% or roughly $451 billion in estimated full-year 2018 origination volume. “National” annual home price appreciation has slowed to a three-month running average of roughly 3% vs. 6% from one year ago but now means that over 95% of homeowners with a mortgage now have equity in their homes. Equity means the increased possibility of cash-out refinance and even though a smaller number of borrowers are refinancing, 75% of those doing so are electing cash-out transactions. In an effort to promote origination volume, soliciting for cash-out refinance has become popular among servicers and thus contributing to higher prepay speeds. As recently as end-of-month September, factor tapes still supported actual prepay speeds in the high 8% to high 9% CPR’s on Fannie Mae 30-Year 3% and 3.5% coupons respectively. In years prior, the realized CPR’s adhered to a floor that was around 6%. In today’s environment, underwriting standards are loosening and cash out refinance activity is now accounting for a 3% to 4% CPR. In this easier underwriting environment, MIAC sees an 8% floor as a realistic expectation. As rates trend higher, further rate increases will have an increasingly smaller impact on the prices of the large population of OTM MSR assets.
MSR Transaction Activity
Recent “large” transactions which we define as deals containing $1 to $5 plus billion in unpaid principal balance have validated our very granular GSA prices. As for smaller offerings, the price/multiple spread is narrowing. Smaller offerings, defined as $500 million to $1 billion, are increasingly becoming the target of some larger buyers who have decided they’d rather not compete at the levels currently being offered for some of the largest offerings. Whether the transaction is large or small, one certainty is that most buyers are increasingly targeting pristine portfolios from well-capitalized sellers. While each buyer has their own definition of “thinly” capitalized or otherwise “at risk” counterparties, the sellers most apt to incur a price adjustment and/or fewer bids are those firms with a net worth less than $10 million.
The smallest packages categorized as $300 million or less in unpaid principal balance are trading at a robust pace too but at prices that “on average” range anywhere from 10 to 20 basis points lower than the bid prices obtained on larger offerings. In addition to the reduced economies of scale afforded by larger MSR trades, acquisition cost is one of the reasons that smaller deals can trade at a discount to larger offerings. The legal and due diligence cost that a buyer may incur to acquire a portfolio can influence how a firm might bid on a smaller trade. Even so, it is the smaller trades that can often create the largest margins and in a quest for margin, increasingly we see larger buyers bidding on smaller offerings but sometimes with a more rigid approach to price and term negotiations.
Regardless of size, not all bids are as they might appear on the surface. Differences in prepay protection periods, non-reimbursable advances, non-payment for assets that are 60 or more days delinquent, fee deducts for seriously delinquent MSRs, loan kicks, and possible set-up fees are just a few of the pitfalls that can quickly affect a seller’s net execution price.
FEMA Declared Disaster Areas
Over the past two months, the US mainland has been battered by two intense hurricanes, Hurricane Florence and Hurricane Michael. Both storms caused widespread power outages and damage to residential and commercial real estate. This includes an estimated 20% of all mortgaged properties in North Carolina and 10% of the properties in South Carolina. As with all FEMA declared disasters, natural or otherwise, MIAC’s standard practice is to identify and flag at-risk properties. Borrowers that live within the boundaries of these high-risk areas are prone to higher delinquencies and subsequent defaults and should be managed accordingly. Naturally, not all borrowers in a FEMA declared disaster area that go delinquent will go into foreclosure but identification and ongoing monitoring should be part of one’s internal valuation process. Likewise, for borrowers that choose to take advantage of certain mortgage assistance options, those assets should be flagged accordingly. For instance, if a borrower is granted payment forbearance, to ensure that assets in forbearance are properly valued, it is crucial that MIAC is made aware. The only way to ensure an accurate valuation is to provide all necessary and applicable data. MIAC will always request additional data if necessary in an effort to provide clients with the most accurate valuation possible.
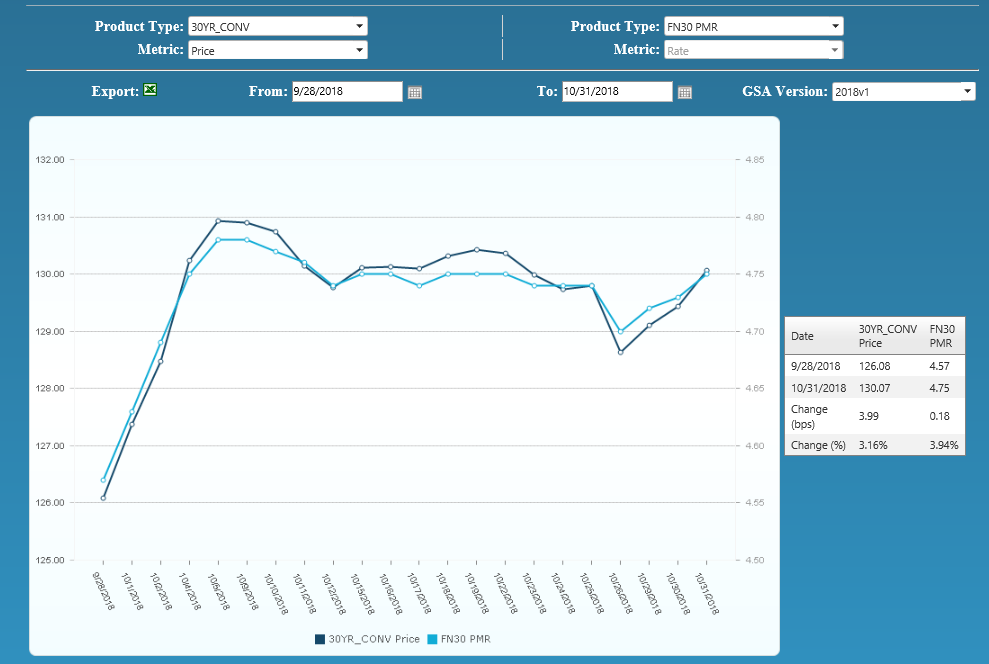
Figure 3: Year-to-Date Conv 30-YR 4.00% 2018 GSA Index Source: MIAC Analytics
MIAC’s MSR Valuation department provides MSR valuation advisory services to over 200 institutions totaling nearly $2 trillion in residential and commercial MSR valuations every month. Learn about MIAC’s industry-leading valuation, brokerage, and/or GSA benchmarking, and please reach out to your MIAC representative for more information.
Residential MSR Market Update – October 2018
Author
Mike Carnes, Managing Director, MSR Valuations, Capital Markets Group
Mike.Carnes@miacanalytics.com