Month-over-Month
From end-of-month October to end-of-month November, the MIAC Generic Servicing Assets (GSAs™) Conv_30 Index decreased by 4.30%, and the GNII_FHA_30 Index decreased by 6.90%.
During the month of November, Conv_30 Index OAS’s tightened to close the month at 1,307.7 bps, for a decrease of 7 bps. The GNII_FHA_30 Index OAS’s widened to 1,638.3 bps for a month-over-month increase of 2.8 bps. Despite recent optimism over the temporary approval of a Covid-19 vaccine(s) and the hope of an eventual mass immunity, MIAC’s Primary Mortgage Rate was lower by 14 bps for the month of November, closing at 2.80%. This compares to Freddie Mac’s weekly PMMS rate that from the last posting in October to the last posting in November dropped by 9 basis points to end the month at 2.72%.
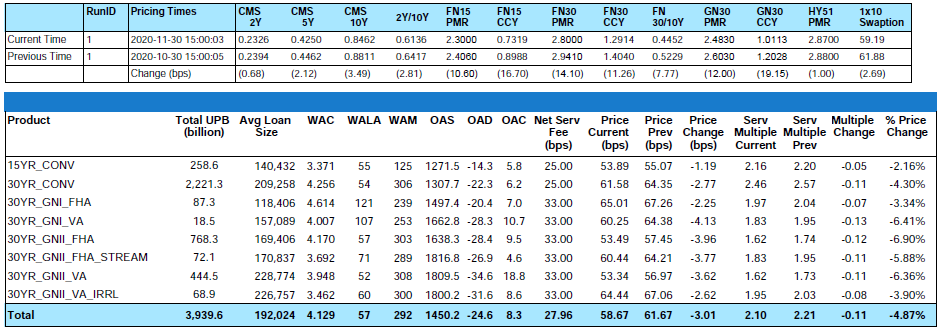
Figure 1: Month-over-Month Pricing Change by Product Source: MIAC Analytics™
November’s rate rally means that year-to-date 11/30 mortgage rates are now lower by 106 bps. While it is true that prevailing market conditions have not been kind to MSR values, origination gains have mostly offset the blow. Year-to-date “legacy” MSR values are lower by 38%, but due to a combination of payoffs and the increased saturation of lower note rate MSRs, for some GAAP MSR values are beginning to show some improvement depending on the balance of new adds vs. payoffs. Another factor contributing to the recent stabilization is the need for scale and the insatiable appetite for recapture-rich portfolios.
Figure 2: Year-to-Date Pricing Change by Product Source: MIAC Analytics™
Forbearance Update
From its peak of 8.5% in early June, the Mortgage Bankers Association’s latest Forbearance and Call Volume Survey revealed that as of December 6, 2020, the total number of loans now in forbearance is 5.48% or roughly 2.7 million homeowners. In the latest report, the share of Fannie Mae and Freddie Mac borrowers in forbearance dropped to 3.26%. The number of Ginnie Mae loans in forbearance is now 7.68% and private-label securities is now 8.89%. Although the total percentage of borrowers in forbearance decreased by 6 basis points in the first week of December, new forbearance request reached their highest level since the week ending August 2. Compared to the last two months, increasingly more and more homeowners exiting forbearance are using modification – a sign that not all borrowers have fully recovered or are even working again.
Prepayment Update
For more reasons than one, 2020 has safely secured its place in the record books. The resulting all-time low in mortgage rates and its impact on prepayments wreaked havoc on MSR values but for most, resulted in a record number of originations including the opportunity to recapture your existing customers. On December 17th the Freddie Mac Primary Mortgage Market Survey (PMMS) rate hit a new low of 2.67%. This is down from 2.71% from the week prior and marks the 15th new record this year. Despite prepayments falling 11% from October’s 16-year high, with interest rates at record lows and an estimated 75% of outstanding conventional mortgages having at least 50 bps of incentive to refinance, prepay activity will almost certainly remain elevated. During the month of November 10-year US Treasury rates moved higher but as evidenced from the chart below, mortgage rates continue their decent and ultimately a small step toward the normalization of Primary-Secondary spreads. While further spread normalization and subsequently falling rates are possible, as concerns hopefully moderate in 2021, look for rates to rise incrementally throughout the upcoming year to an estimated 2.90% by the end of 2021.

Figure 3 Source: Freddie Mac, Goldman Sachs Global Investment Research
Continuing the topic of prepayments, in focus this month are VA MSRs. To qualify for GNMA securities VA borrowers must have made 6 consecutive payments since their last refinance. This rule was put in place to slow speeds, but as you can see, immediately upon qualification, speeds ramp up in this report to as high as 88% in the month immediately following the time period when they once again become eligible for GNMA securities. Originations and buyers alike are cautioned to keep this into consideration and are well-advised to consider models that accurately distinguish (for example) the differences between FHA and VA credit and behavioral characteristics. MIAC utilizes CORE™ to model distinctly FHA and VA prepayments, forbearance, delinquency, and servicer specific recapture behavior.
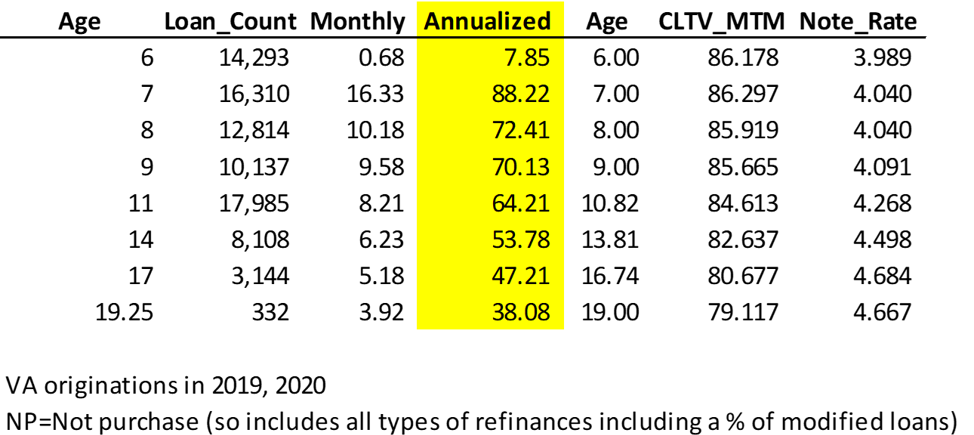
Figure 4 Source: MIAC Analytics™
MSR Liquidity Update
Bulk MSR Market
As we progress further and further into the Covid environment, we are beginning to see some stabilization and even improvement in not just MSR values but also improved liquidity of those MSRs. For example, from end-of-month July to end-of-month October MSR values largely improved because with each subsequent month both realized voluntary prepayments and unemployment rates declined. Sadly, we backtracked slightly in November with primary-secondary spread tightening mostly contributing to another drop in primary mortgage rates resulting in higher voluntary speeds.
Still, we are seeing a huge surge in the amount of MSR market transactions causing some to recalibrate their valuation models. In the third quarter of 2020 approximately $70.8 billion in Bulk MSRs transferred. Through Q320 just over $200 billion transferred vs. $450 billion for the first 9 months of 2019. We expect future quarters to be significantly higher trading volume. MIAC was directly involved in pricing over $150 billion (75% of all bulk transactions) in both negotiated and public bulk auctions in Q320.
MIAC tracks MSR pricing at the very granular cohort level GSAs (“Generic Servicing Assets”) which enables very precise methods of measuring bulk MSR market pricing. GSA pricing reflect MIAC’s detailed price discovery methods which we often aggregate to facilitate a higher-level price summary. For example, here are a few indicative GSA cohort prices on November end by discrete note rates and vintage year.
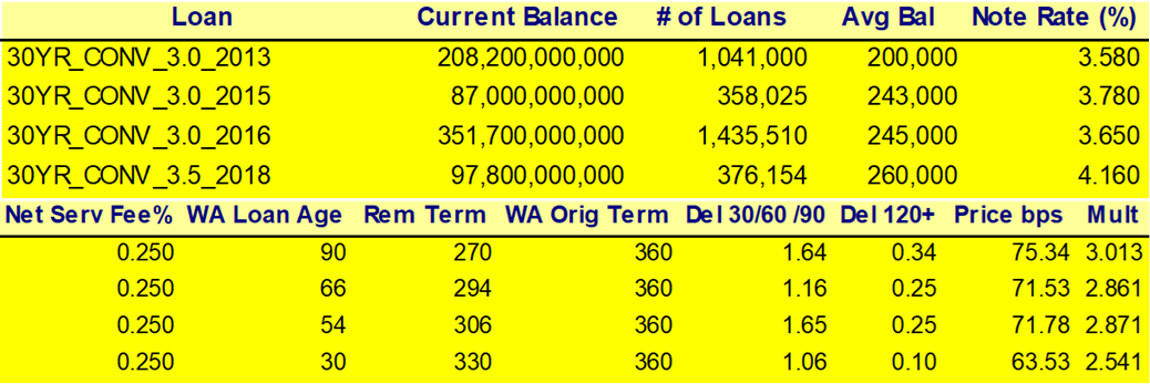
Figure 5 Source: MIAC Analytics™
The portfolio composition of each bulk package is very distinct, however, if one aggregates GSA pricing at the Note Rate level, the trade levels range as follows:
Agency
4% Note Rate – 2.4 to 2.6 multiple
3.75% Note Rate – 2.7 to 2.9 multiple
3.50% Note Rate – Low 3’s multiple
3.25% Note Rate – 3.30 to 3.50 multiple
2.75% Note Rate – High 3’s to 4.25 multiple
Ginnie Mae
The diversity of collateral attributes in GNMA MSR is very distinct including FHA, Streamline, VA, IRRLS, and realized delinquency/forbearance rates. And with most GNMA MSRs delivered into the GNMA II pools, the retained servicing fees can vary wildly as well. For newly underwritten FHA GNMA MSR with no forbearance and a 2.75% note rate, MSRs values are a low 3.0 multiple. The market clearing GNMA buyers also have the best recapture platforms and lower cost structures.
More seasoned forbearance impacted GNMA on average will fetch around a 1.5 to 2.2 multiple, again to shops with the best recapture capability.
Below is pricing of seasoned FHA GNMA MSRs with the collateral attributes made transparent.

Figure 6 Source: MIAC Analytics™
Co-Issue
The prices being paid on bifurcated and non-bifurcated Co-Issue MSRs have dramatically improved too. At the onset of the pandemic, in some instances, buyers artificially set their par rates to 2% or less and communicated to their clients that no purchase price would be paid on any MSRs where the note rate was more than 100 bps higher than their stated par rate. Some who lacked the trifecta of having correspondent relationships, co-issue relationships, and retention capabilities were forced to give away their MSRs for free, but that did not last very long. As for the bulk market, buyers returned as they gained confidence in their ability to project advances, and for the preservation of market share were literally raising their prices on a weekly basis to stay competitive. At present buyers Agency flow sellers can expect Conventional 30 base values mostly in the high 3 to low 4 multiple level.
MIAC’s MSR Valuation department provides MSR valuation advisory services to over 200 institutions totaling nearly $2 trillion in residential and commercial MSR valuations every month.
.
Residential MSR Market Update – November 2020
Author
Mike Carnes, Managing Director, MSR Valuations Group
Mike.Carnes@miacanalytics.com