Month-over-Month
From end-of-month April to end-of-month May, the MIAC Generic Servicing Assets, (GSAs™) Conv_30 Index decreased by 3.82% and the GNII_FHA_30 index decreased by 6.38%.
In larger GSA cohorts, which are actively traded in the MSR market, the Conv30_3.5_2016 decreased by 1.54% and the GNII_FHA30_3.5_2016 cohort decreased by 8.40%. During the month of May, Conv_30 Index OAS’s widened to close the month at 798.5 bps for an increase of 39.6 bps. Likewise, GNII_FHA_30 Index OAS’s widened to 895.0 bps for a month-over-month increase of 69.0 bps. The greater reduction in Ginnie Mae MSR values was partly attributed to a non-parallel 39 basis point downward adjustment of the 5-Yr swap rate (a common MSR market benchmark for earnings rate) coupled with the higher average escrow percentages that often accompany Ginnie Mae servicing rights.
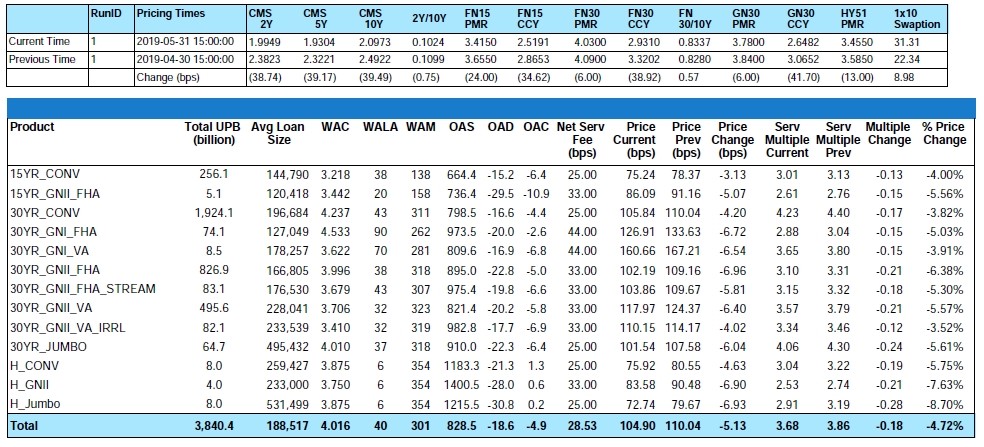
Figure 1: Month-over-Month Price Change by Product Source: MIAC Analytics
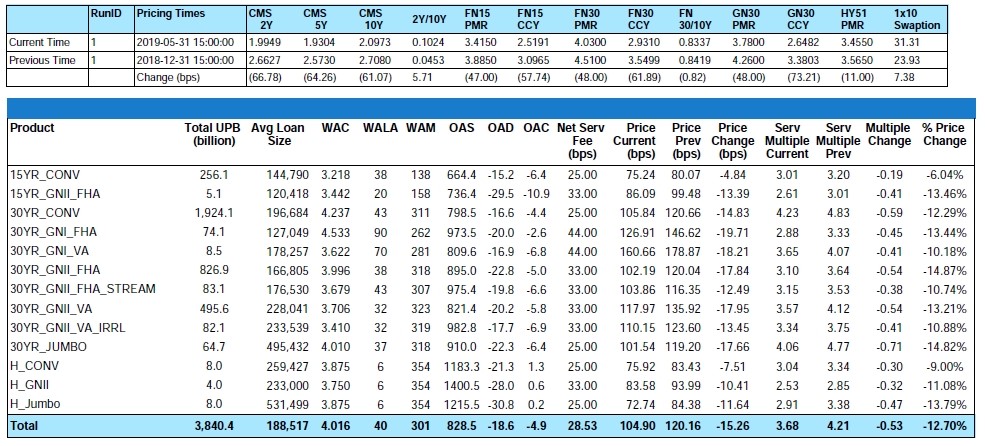
Figure 2: Year-to-Date Price Change by Product Source: MIAC Analytics
Prepayment News
At current rate levels vs. the existing distribution of outstanding mortgages, for every 25 bps drop in mortgage rates approximately 7% of outstanding borrowers will be considered “in-the-money” and at increased risk for refinance. As supporting evidence, during the month of May Conventional 30-year MBS prepay speeds increased by 18% from 11% to 13%. To illustrate the impact of aging and the influence that newer vintage, higher WAC MSRs is having on aggregate CPR performance metrics, 2018 vintage 4.5% MBS coupons posted a prepay rate of 21% vs. 14% for the 2011 vintage 4.5% coupons. Likewise, prepay speeds on Ginnie pools remain elevated with 8 to 10 months seasoned 4.0% coupons printing at a 33% CPR potentially negating the idea that newer vintage borrowers should exhibit a lower prepay ramp.
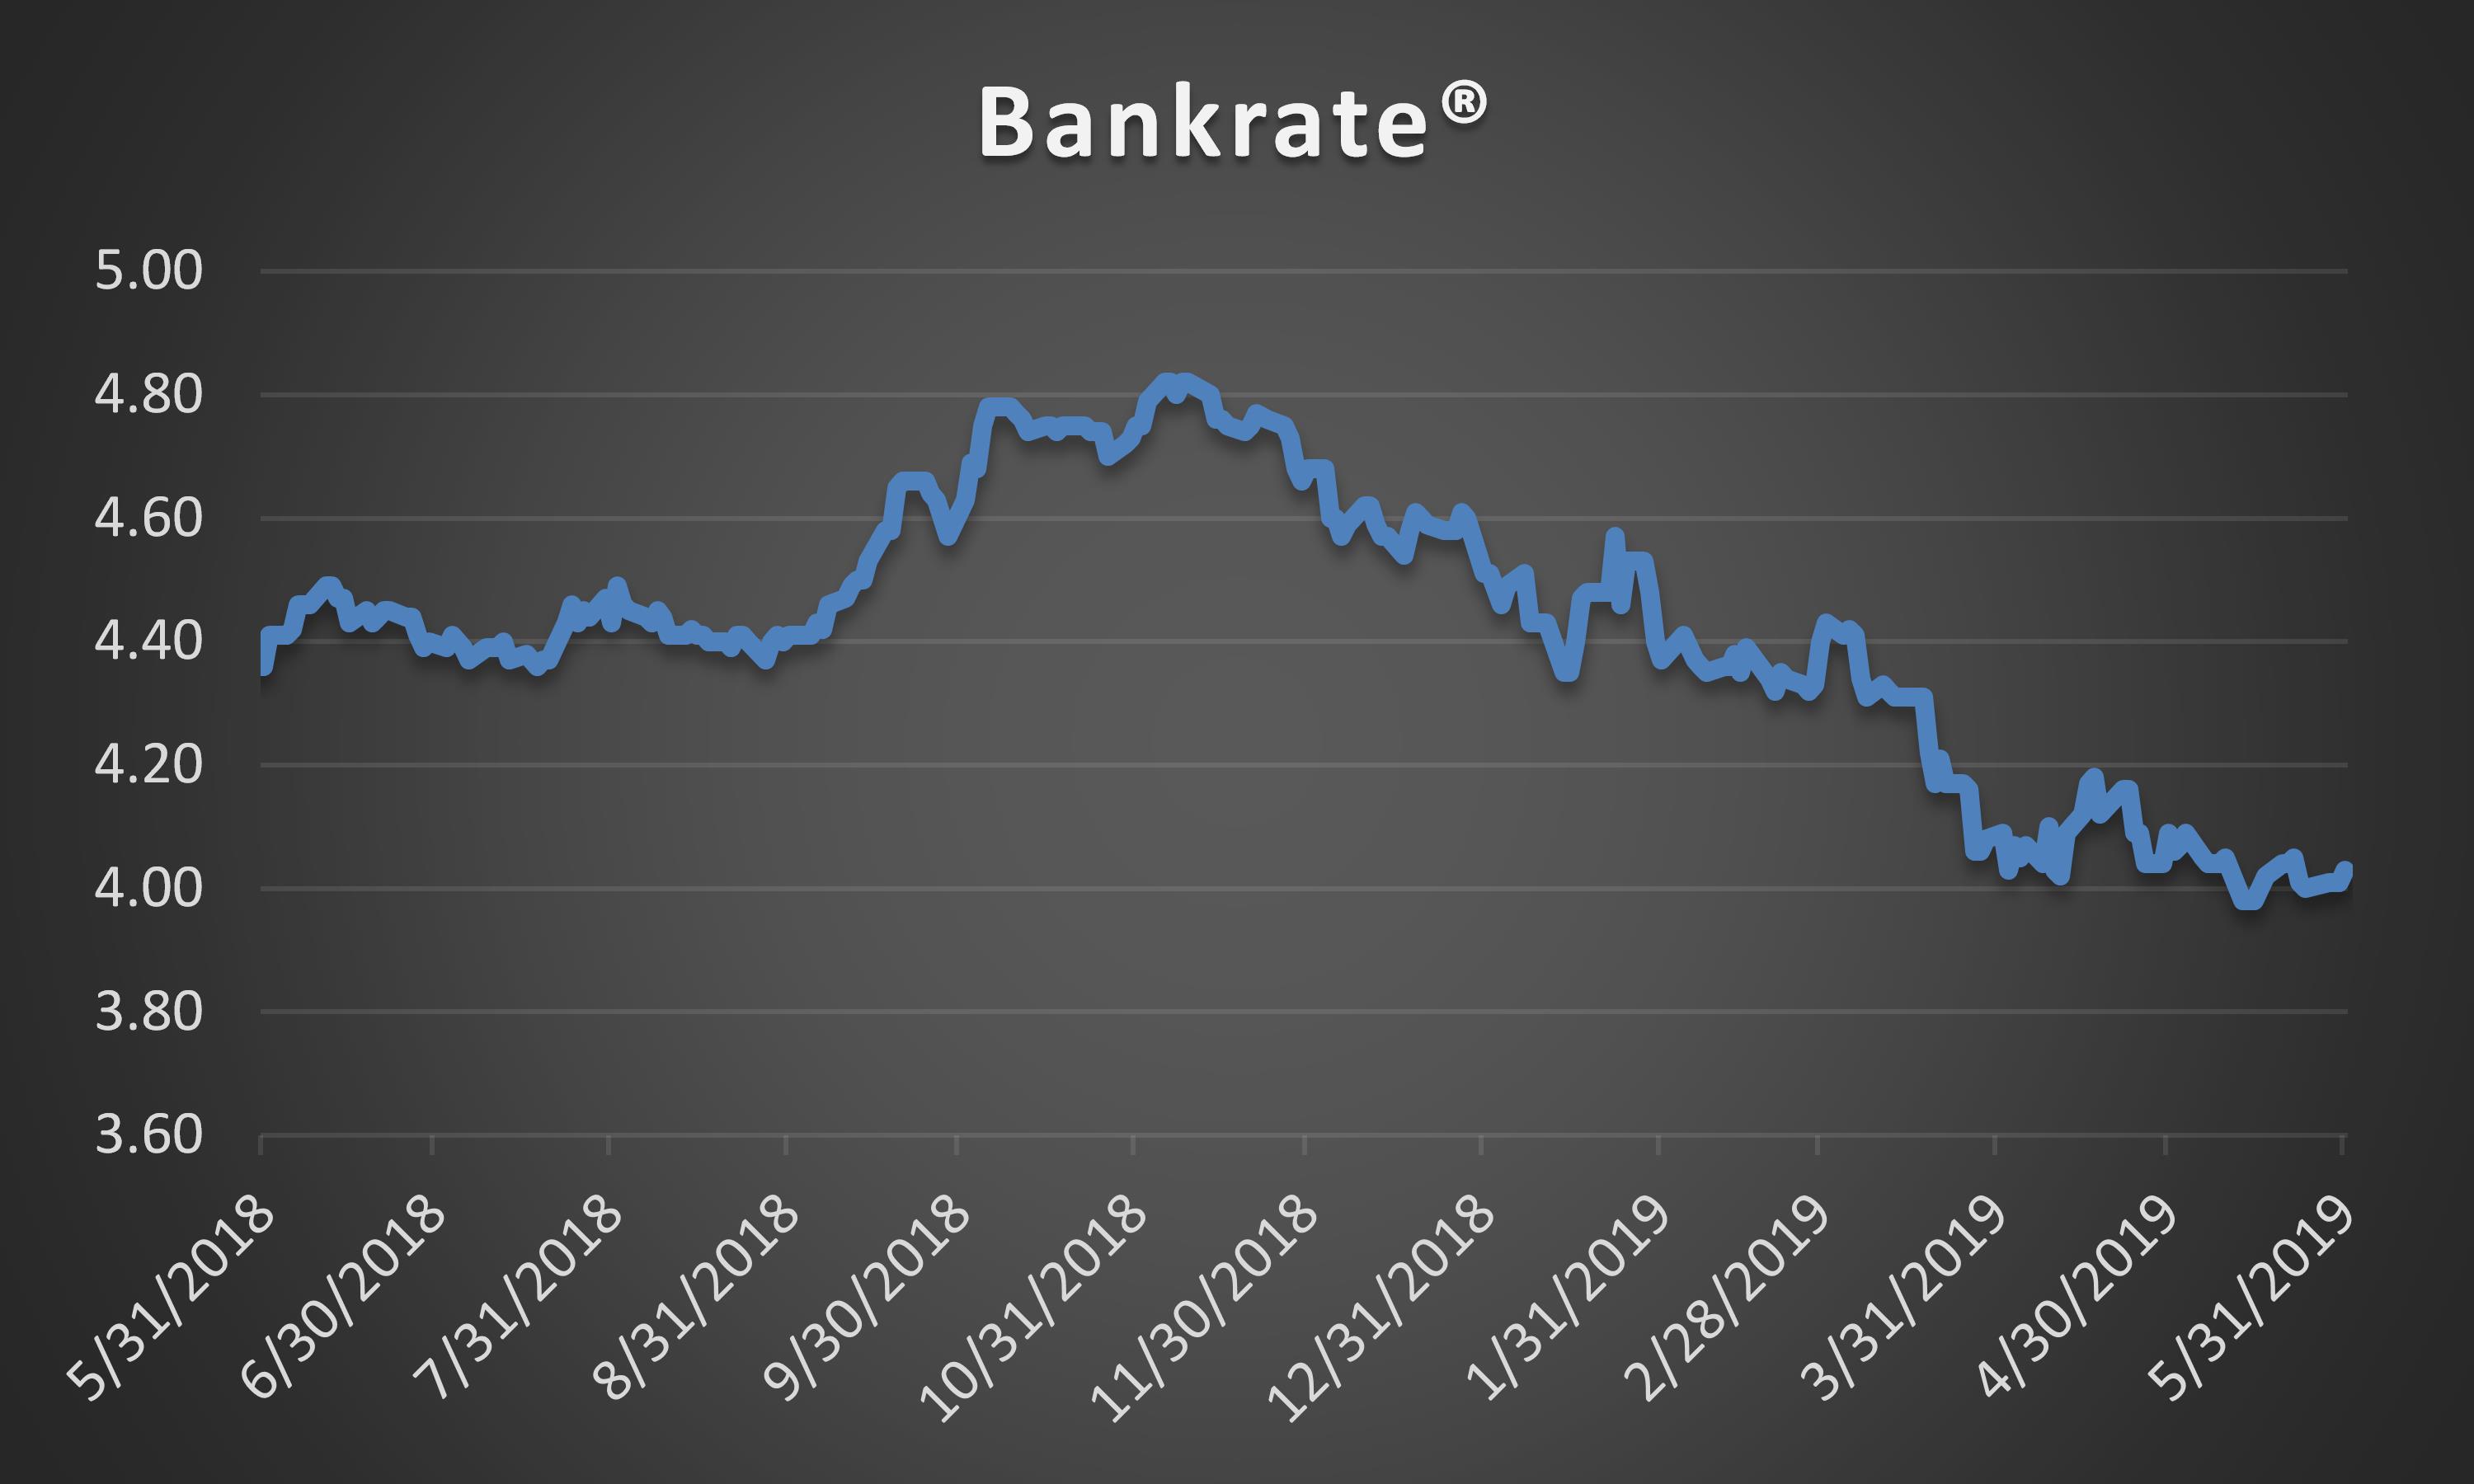
From end-of-month April to end-of-month May, Bankrate® was lower by six (6) basis points to end the month at 4.03%. As bad as this might sound, ongoing volatility, widening Primary/Secondary spreads, and the increasingly diverse range of opinions on what constitutes a primary rate wasn’t compelling enough to cause Freddie Mac or the MBA to revise their average 2019 30-year fixed-rate mortgage estimate from 4.30% and 4.40% respectively. If there is a silver lining, lower mortgage rates can mean lower DTI ratios. According to Goldman Sachs, throughout 2016-2018 the share of mortgages with debt-to-income ratios above 43% trended up as interest rates increased and as home prices grew faster than incomes. In 2019, the share of high DTI loans is in decline now that mortgage rates have eased and house price growth has slowed.
Simplified Capital Rule Poised for Adoption
In a widely anticipated but much-delayed announcement, Community banks (generally, those with less than $250 billion in assets), in a rule that could become final as soon as this month, “may” soon become the beneficiary of simpler regulatory capital requirements for mortgage servicing assets. The new rule would take effect April 1, 2020, and was approved in a notation vote by the Federal Deposit Insurance Corp. (FDIC) Board on May 28, 2019. The Federal Reserve and the Office of the Comptroller of the Currency (OCC) are expected to also approve the final rule.
According to the Independent Community Bankers of America (ICBA), under the rule community banks would only have to deduct from their capital mortgage servicing assets (MSAs), temporary difference deferred tax assets (DTAs), and investments in the capital of unconsolidated financial institutions if they individually exceed 25% of common equity tier 1 capital of the bank. The simplification proposal will still require a banking organization to apply a 250 percent risk weight to MSAs.
MSR Transaction Activity
Mostly attributed to lower rates (which initially began their rally in mid-November) and the resulting impact on modeled MSR values, fewer numbers of sellers are either required to sell because of increased origination volume “or” want to sell out of fear for a potentially lower execution. Before limiting your options or losing sleep over missed opportunities, keep this in mind. Most offerings are experiencing a significant amount of interest with above average bid participation. Fewer offerings coupled with a stable to growing appetite for especially clean agency MSRs is resulting in increased interest for increasingly fewer opportunities to buy meaning buyers can no longer be as choosey as they were just 6 to 9 months ago. Do I hear the quiet rumblings of a “Seller’s Market”?
In recognition of stiff competition for fewer MSR packages and knowledge that two-thirds of all outstanding conventional and FHA/VA mortgage borrowers have loans that were originated before 2017 and are at lesser but potentially growing risk of refinance, “Large” transactions which we define as deals containing $1 to $5 plus billion in unpaid principal balance continue to validate our very granular GSA prices. As for smaller offerings, the price/multiple spread is narrowing. Smaller offerings defined as $500 million to $1 billion are being targeted by increasingly higher numbers of “Large” transaction buyers. While not always the economies of scale that they want, evidence shows that certain large buyers with excess capacity will gladly purchase a small deal rather than no deal at all.
The smallest packages categorized as $300 million or less in unpaid principal balance are trading at a robust pace too but at prices that “on average” range anywhere from 10 to 20 bps lower than the bid prices obtained on larger offerings. In addition to the reduced economies of scale afforded by larger MSR trades, the acquisition cost is one of the reasons that smaller deals can trade at a discount to larger offerings. The legal and due diligence cost that a buyer typically incurs to acquire a portfolio can influence how a firm might bid on a smaller trade. Even so, it is the smaller trades that can often create the largest margins and in a quest for margin, increasingly we see larger buyers bidding on smaller offerings but usually with a more rigid approach to price and term negotiations.
Regardless of size, not all bids are as they might appear on the surface. Differences in prepay protection periods, non-reimbursable advances, non-payment for assets that are 60 or more days delinquent, fee deducts for seriously delinquent MSRs, loan kicks, and possible set-up fees are just a few of the pitfalls that can quickly affect a seller’s net execution price.
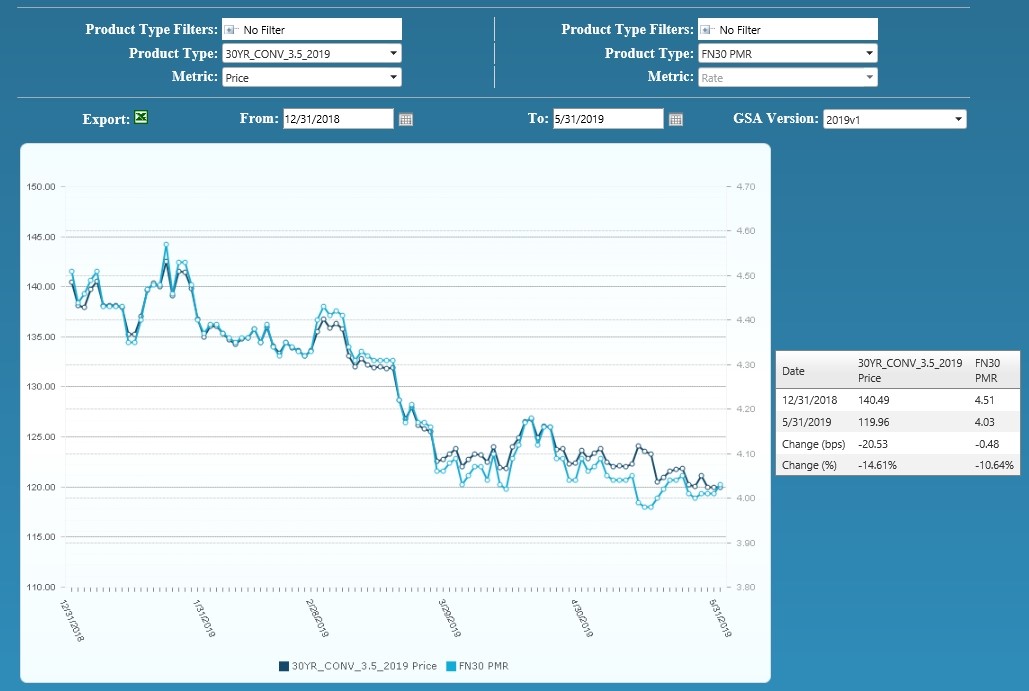
Figure 3: Year-to-Date Conv 30-YR 3.50% 2019 GSA Index Source: MIAC Analytics
MIAC’s MSR Valuation department provides MSR valuation advisory services to over 200 institutions totaling nearly $2 trillion in residential and commercial MSR valuations every month.
Residential MSR Market Update – May 2019
Author
Mike Carnes, Managing Director, MSR Valuations, Capital Markets Group
Mike.Carnes@miacanalytics.com