Month-over-Month
From end-of-month February to end-of-month March, the MIAC Generic Servicing Assets, (GSAs™) Conv_30 Index decreased by 7.26% and the GNII_FHA_30 index decreased by 7.53%.
In larger GSA cohorts, which are actively traded in the MSR market, the Conv30_3.5_2016 decreased by 8.20% and the GNII_FHA30_3.5_2016 cohort decreased by 4.60%. Option-adjusted spread (OAS) measures the spread between fixed income security and the risk-free rate of return, which considers how the embedded option in the fixed income security is likely to change the expected future cash flows and the present value of the security. Servicers often rely on a constant OAS approach for determining their fair market value and hedgers rely on the flatter convexity profile that a stochastic or OAS valuation risk profile often implies. While potentially foolproof in a stable rate environment, strict reliance on a constant OAS in times of extreme volatility can cause a firms “market-to-model” valuation approach to become rich or cheap to benchmark trades. During the month of March, Conv_30 Index OAS’s widened to close the month at 743.3 bps for an increase of 45.2 bps. Likewise, GNII_FHA_30 Index OAS’s widened to 805.5 bps for a month-over-month increase of 13.9 bps. Firms that rely on a constant OAS for determination of fair market value should have internal risk measurements in place that dictate how “rich” or “cheap” a mark-to-model value must be before recalibrating their OAS to ensure compliance with GAAP.
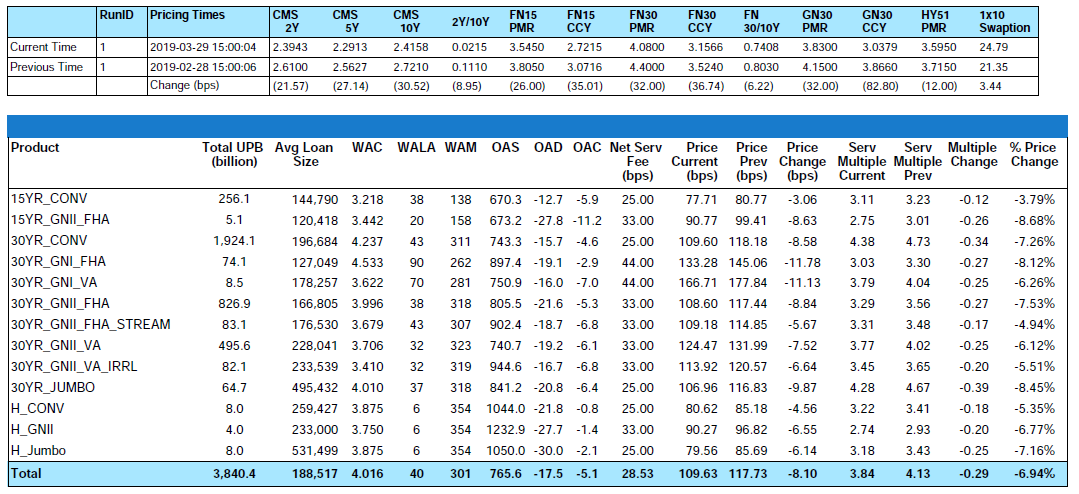
Figure 1: Month-over-Month Price Change by Product Source: MIAC Analytics
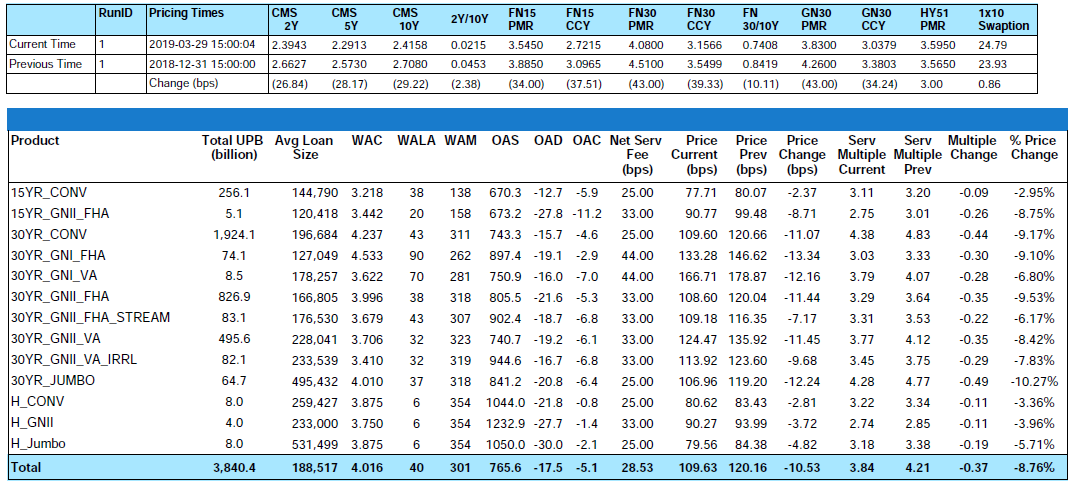
Figure 2: Year-to-Date Price Change by Product Source: MIAC Analytics
Prepayment News
“Uh-oh” was the initial response of most servicers immediately following the Federal Reserve meeting where they expressed concern about the prospect of slower economic growth. The Fed now expects 2.1 percent growth this year, down from the 2.3 percent it forecast in December — and more than a percentage point less than the 3.2 percent growth the White House predicts. The outlook for 2020 is even more unwelcoming with the Fed now projecting growth of just 1.9 percent. Investor concern over this announcement caused mortgage rates to immediately decline resulting in a nearly 75 bps rally since rates last peaked in November 2018. While concerning, the “glass-half-full” inside of me wants to remind all servicers that two-thirds of all outstanding conventional and FHA/VA mortgage borrowers have loans that were originated before 2017 and “guess what”, these seasoned borrowers either have interest rates that are already below current mortgage rates or have already passed up multiple opportunities to refinance. Remember that aging effects both premiums and discounts; however, premiums tend to reach their peak prepayment speeds considerably earlier than discounts making the higher note rate 2018-2019 vintage cohorts much more susceptible to prepayment risk. The MBA is aware of this and despite a recent post rally surge in applications, their refinance index remains in the relatively benign territory because only one-third of outstanding borrowers are currently at an elevated risk for refinancing.
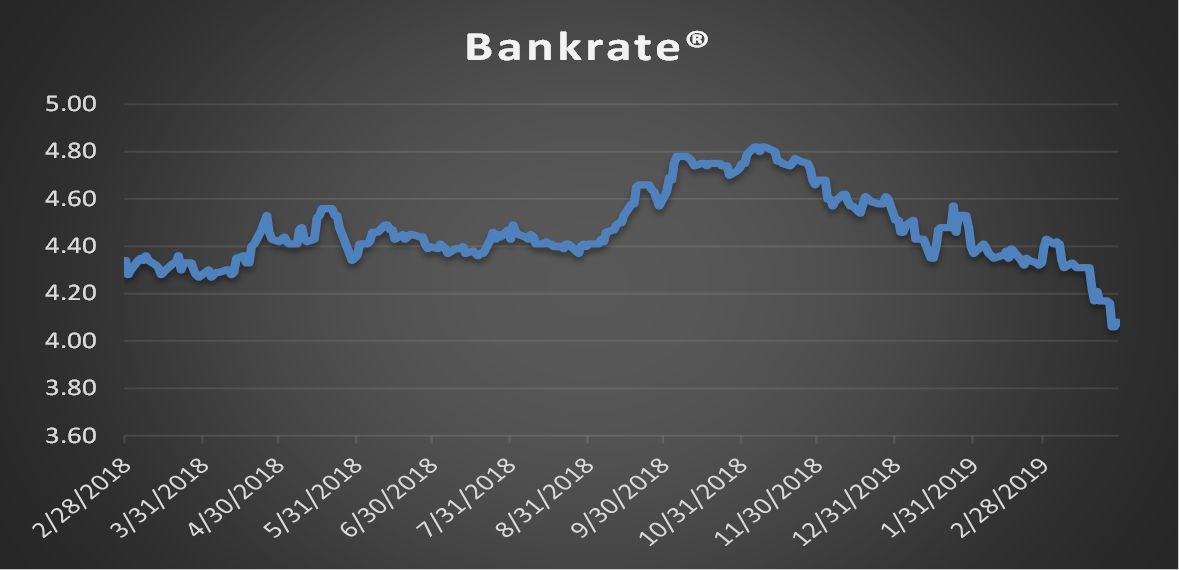
So much for stable rates in February. From end-of-month February to end-of-month March, Bankrate® declined by thirty-two (32) bps to end the month at 4.08%. The volatility caused Freddie Mac to again lower its 2019 30-year mortgage rate forecast to 4.50% and the MBA in their latest financial forecast to drop their projection from 4.80% to 4.60%.
MSR Transaction Activity
“Large” transactions which we define as deals containing $1 to $5 plus billion in unpaid principal balance continue to validate our very granular GSA prices. As for smaller offerings, the price/multiple spread is narrowing. Smaller offerings, defined as $500 million to $1 billion, remain the target of some larger buyers who have decided they’d rather not compete at the lofty levels currently being offered for some of the largest offerings.
The smallest packages categorized as $300 million or less in unpaid principal balance are trading at a robust pace too but at prices that “on average” range anywhere from 10 to 20 bps lower than the bid prices obtained on larger offerings. In addition to the reduced economies of scale afforded by larger MSR trades, acquisition cost is one of the reasons that smaller deals can trade at a discount to larger offerings. The legal and due diligence cost that a buyer typically incurs to acquire a portfolio can influence how a firm might bid on a smaller trade. Even so, it is the smaller trades that can often create the largest margins and in a quest for margin, increasingly we see larger buyers bidding on smaller offerings but usually with a more rigid approach to price and term negotiations.
Regardless of size, not all bids are as they might appear on the surface. Differences in prepay protection periods, non-reimbursable advances, non-payment for assets that are 60 or more days delinquent, fee deducts for seriously delinquent MSRs, loan kicks, and possible set-up fees are just a few of the pitfalls that can quickly affect a seller’s net execution price.
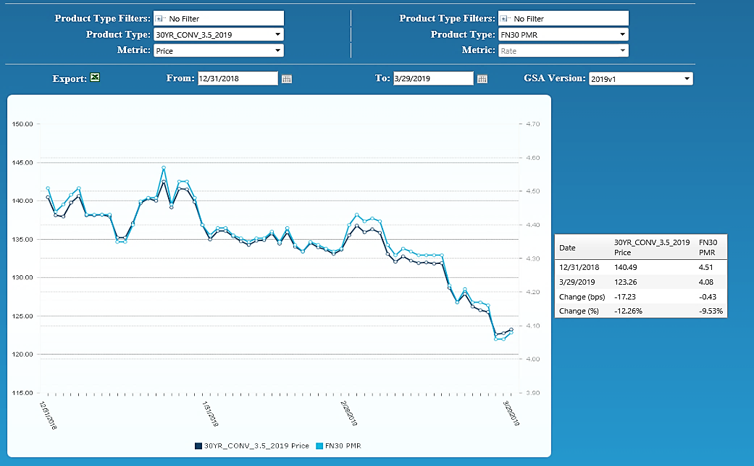
Figure 3: Year-to-Date Conv 30-YR 3.50% 2019 GSA Index Source: MIAC Analytics
MIAC’s MSR Valuation department provides MSR valuation advisory services to over 200 institutions totaling nearly $2 trillion in residential and commercial MSR valuations every month.
Residential MSR Market Update – March 2019
Author
Mike Carnes, Managing Director, MSR Valuations, Capital Markets Group
Mike.Carnes@miacanalytics.com