Month-over-Month
From end-of-month June to end-of-month July, the MIAC Generic Servicing Assets (GSAs™) Conv_30 Index increased by 1.33% and the GNII_FHA_30 index increased by 2.54%.
In larger GSA cohorts, which are actively traded in the MSR market, the Conv30_3.5_2016 increased by 1.30% and the GNII_FHA30_3.5_2016 cohort increased by 3.76%. During the month of July, Conv_30 Index OAS’s tightened to close the month at 828.0 bps for a decrease of 26.0 bps. Likewise, GNII_FHA_30 Index OAS’s tightened to 983.6 bps for a month-over-month decrease of 42.8 bps.
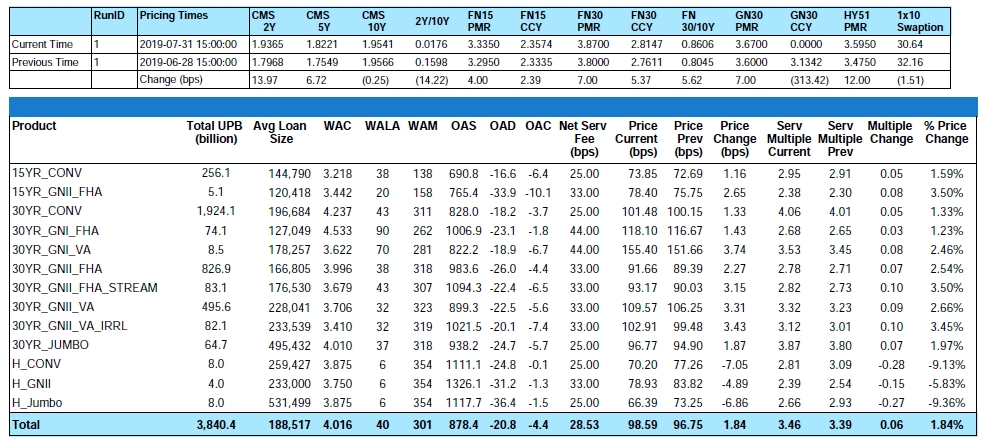
Figure 1: Month-over-Month Price Change by Product Source: MIAC Analytics™
Note that GSAs are predominantly priced to the larger trades. The conundrum in Fair Market world right now is to include or not include recapture into a Fair Market Value. For those in competing for the largest and most pristine trades, it’s not uncommon to have to do one of the following to be in competition for those trades.
- Use a 5-6% yield or
- Model using CPRs net of recapture or
- Incorporate recapture value using recapture rates as high as 25% at an average gain on sale margin of 1%
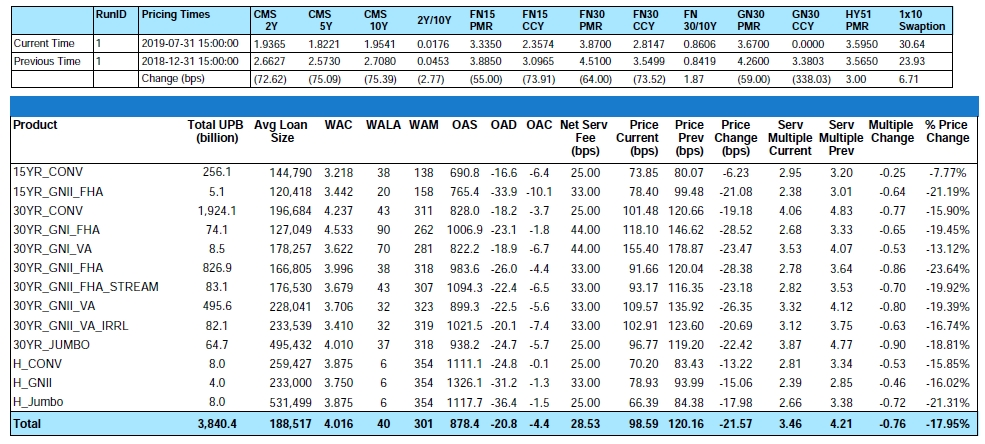
Figure 2: Year-to-Date Price Change by Product Source: MIAC Analytics™
Prepayment News
“In-The-Moneyness”, is obviously the single largest driver of prepay rates “and” according to Credit Suisse, the 1-Month July actual CPR on Fannie Mae 30-Year 4.15% and 4.65% WAC 2018 vintage MSRs was 18.3% and 29.8% respectively. With nearly 10 million 30-year mortgage holders able to refinance and save 0.75% or more off of their current interest rate, we anticipate that prepay speeds will increase by 12% in August. Ginnie Mae borrowers continue to prepay faster than conventional MBS. As an example, during the month of July, 3.95% and 4.47% WAC 2018 vintage Ginnie Mae II respectively experienced a 25.5% and 39.8% annualized CPR.
I draw out 2018 vintage borrowers largely because they are seeing sub-4% mortgage rates for the first time and are most apt to refinance sooner. Case in point, 2017 vintage 4.06% WAC Fannie Mae 30-Year posted a much slower one month July CPR of 14.6% and 3.90% WAC Ginnie Mae II posed a July CPR of 20.0%.
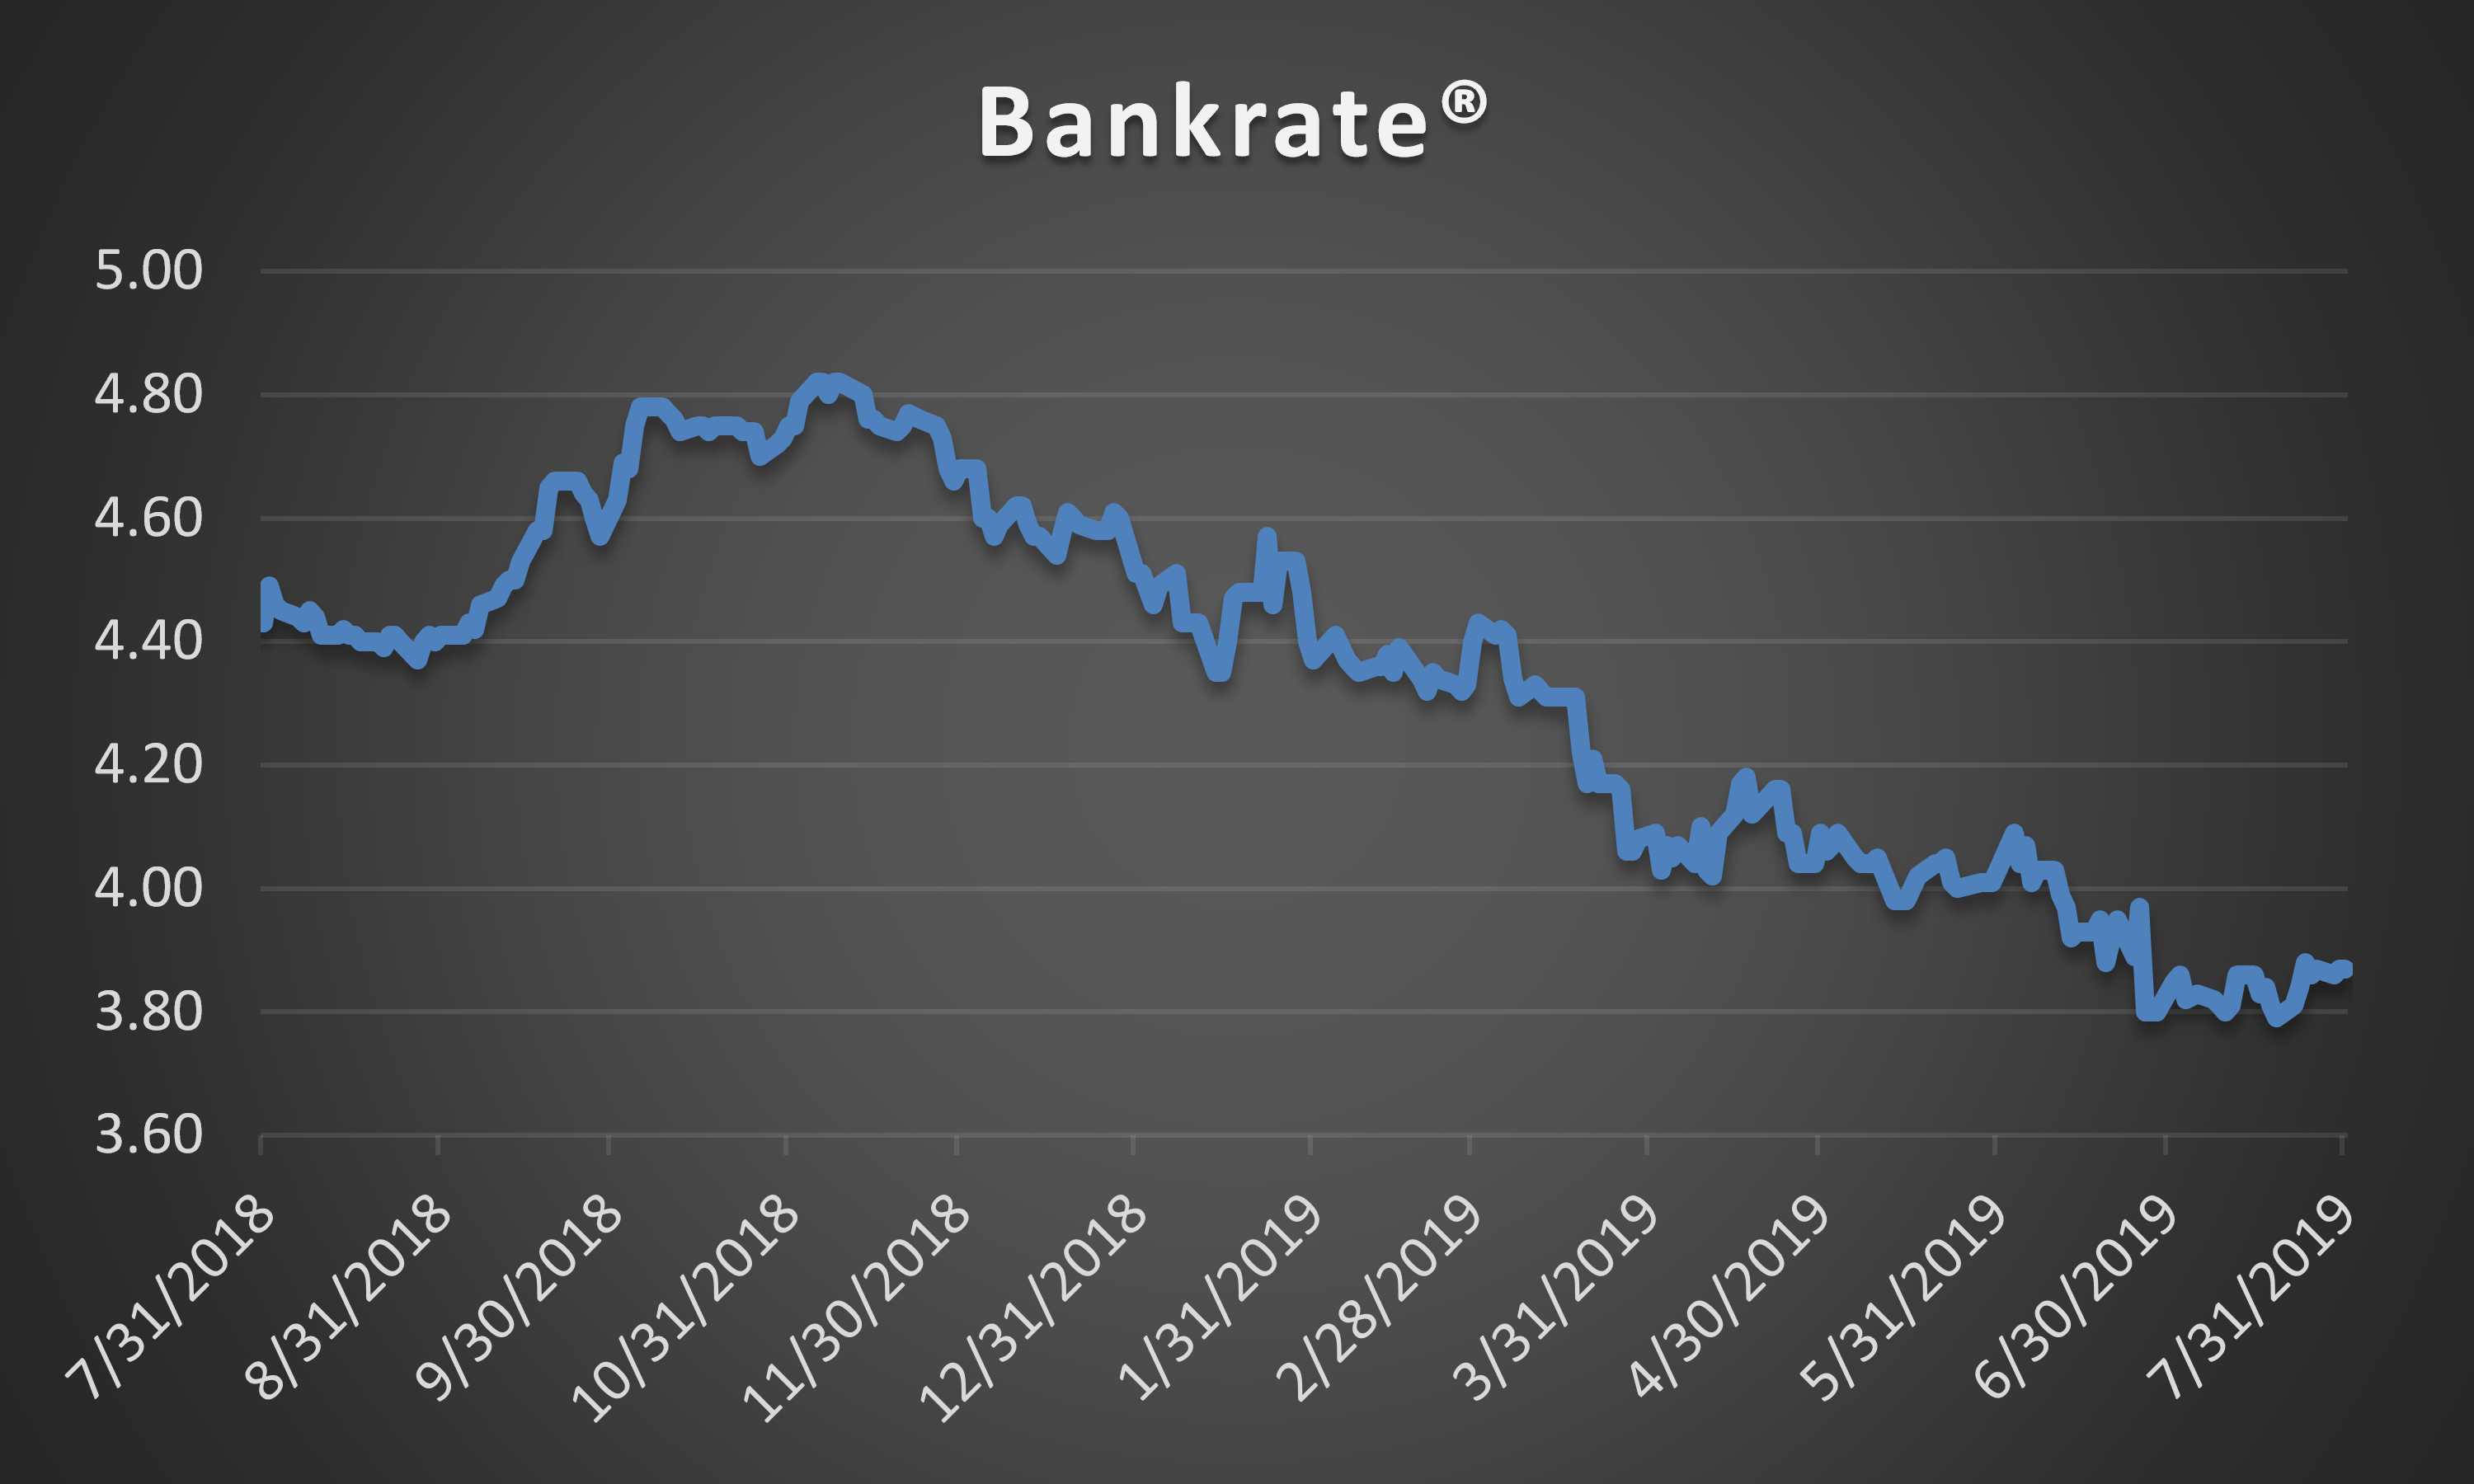
From end-of-month June to end-of-month July, Bankrate® was higher by seven (7) basis points to end the month at 3.87%. Due to the ongoing volatility and widening Primary/Secondary spreads, servicers should exercise some caution when it comes to any sole reliance on a single benchmark. While consistency (particularly for firms hedging their MSRs) is critical, we’re seeing an increasingly diverse range of opinions on what constitutes a primary rate not to mention sometimes extreme day-over-day volatility. As an example, the last Freddie Mac weekly survey rate reported in July was 3.75%. No matter the source, servicers that rely on a secondary rate plus a spread must be mindful of widening and tightening spreads and servicers reliant on a single benchmark primary would be well served to look at more than one benchmark just to ensure its consistency with other leading indicators.
Concerns about global growth and ongoing trade disputes have pushed long-term interest rates lower and recently caused the MBA to revise their average 2019 30-year fixed-rate mortgage estimate from to 4.0% and 3.9%. Freddie Mac believes that that average 30-year fixed rate mortgage will be 4.1% in 2019 before decreasing modestly to 4.0% in 2020. On a more positive note, even though YTD MSR values are substantially lower, at least we have more of it to value. On the latest July forecast report, Freddie Mac revised their full-year origination forecast to $1.796 trillion and the MBA to $1.787 trillion. This is up from roughly $1.6 trillion in 2018.
In Other News
- Due to the ongoing trade dispute, and to ensure against a further economic slowdown, in July the Federal Open Market Committee (FOMC) voted to cut their target rate by 25 bps. Since then, Goldman Sachs upgraded the odds that there would be a total of 3 rate cuts in 2019. Goldman said it no longer expects the United States and China to agree on a trade deal before the November 2020 presidential election.
- In July Ginnie Mae released a much-anticipated proposal that would forecast an individual issuer’s performance over a two-year period under likely and adverse conditions. The proposal is in line with the goals laid out by Ginnie Mae in its 2020 modernization plan and upon implementation will examine projected balance sheet and income cash flow statements using a proprietary rating method to assign an issuer-risk grade for the period forecasted and ultimately a projection for insolvency risk. With non-depositories accounting for 78% of Ginnie’s issuance in 2018 and 65% of outstanding Ginnie Mae servicing rights as of April 2019, the plans clearly address the ongoing concentration of nonbank counterparties. Comments on the proposed plan will be accepted through the end of August.
- In other July news, in an effort to improve the risk profile of HUD’s housing finance programs, effective with case numbers assigned on or after September 1, 2019, the FHA will lower its maximum LTV requirements for cash-out refinance transactions from 85% to 80%. This policy change means that the FHA is now consistent with the maximum cash-out LTV allowed by the GSE’s.
- Leading delinquency indicators are mixed. According to CoreLogic, the mortgage delinquency rate sits at its lowest point in over 20 years after descending annually for 17 straight months through May 2019. CoreLogic reports that 3.6% of mortgages were in some stage of delinquency in May for a 0.6 percentage point decline from last year – but wait a minute! At the same time, the MBA released its National Delinquency Survey which showed delinquencies were on the rise. According to the MBA, the overall delinquency rates for mortgages in the second quarter was 4.53% for an increase of 17 basis points annually and 11 basis points from the start of the year.
MSR Transaction Activity
With rates on 30-year mortgages at their lower level since late 2016 and refinance fever sweeping across the US, MSR transaction activity has slowed to a mere trickle. As measured by transfers, over $200 billion in MSRs changed hands in the 2nd quarter of 2019 but most of that activity was the result of 4Q’18 and 1Q’19 transactions. Of late, lower rates (which initially began their rally in mid-November), and the resulting impact on modeled MSR values means that fewer numbers of servicers are either required to sell because of increased origination volume and resulting gain on sale “or” want to sell out of fear for a potentially lower execution.
In recognition of stiff competition for fewer MSR packages “Large” transactions which we define as deals containing $1 to $5 plus billion in unpaid principal balance continue to validate our very granular GSA prices. As for smaller offerings, the price/multiple spread is narrowing. Smaller offerings defined as $500 million to $1 billion are being targeted by increasingly higher numbers of “Large” transaction buyers. While not always the economies of scale that they want, evidence shows that certain large buyers with excess capacity will gladly purchase a small deal rather than no deal at all.
The smallest packages categorized as $300 million or less in unpaid principal balance are trading at a robust pace too but at prices that “on average” range anywhere from 10 to 20 bps lower than the bid prices obtained on larger offerings. In addition to the reduced economies of scale afforded by larger MSR trades, the acquisition cost is one of the reasons that smaller deals can trade at a discount to larger offerings. The legal and due diligence cost that a buyer typically incurs to acquire a portfolio can influence how a firm might bid on a smaller trade. Even so, it is the smaller trades that can often create the largest margins and in a quest for margin, increasingly we see larger buyers bidding on smaller offerings but usually with a more rigid approach to price and term negotiations.
Regardless of size, not all bids are as they might appear on the surface. Differences in prepay protection periods, non-reimbursable advances, non-payment for assets that are 60 or more days delinquent, fee deducts for seriously delinquent MSRs, loan kicks, and possible set-up fees are just a few of the pitfalls that can quickly affect a seller’s net execution price.
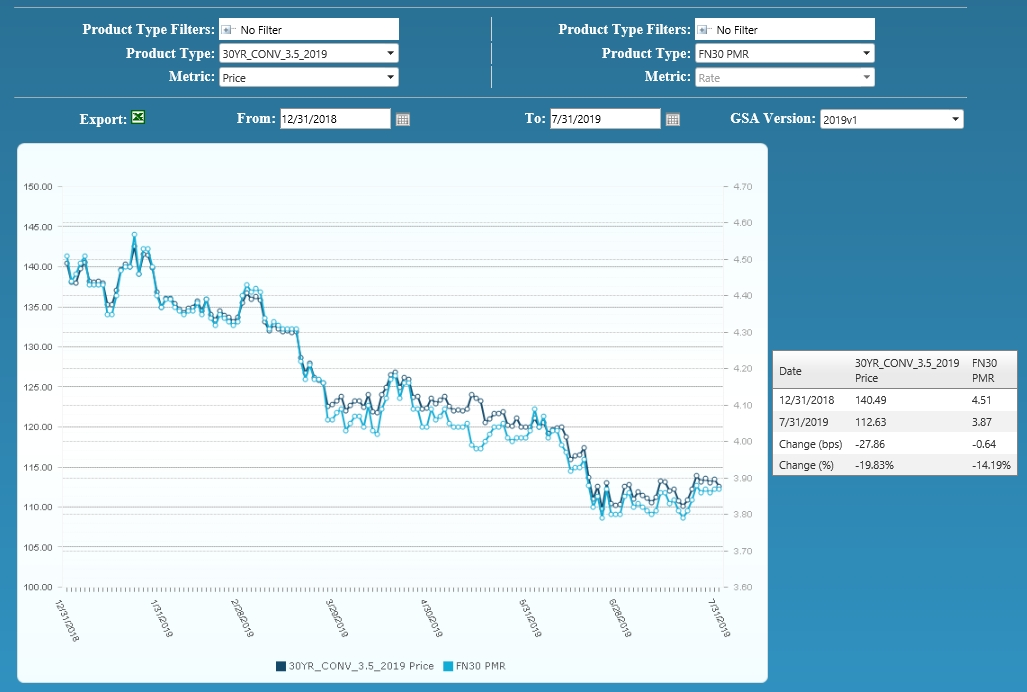
Figure 3: Year-to-Date Conv 30-YR 3.50% 2019 GSA Index Source: MIAC Analytics™
MIAC’s MSR Valuation department provides MSR valuation advisory services to over 200 institutions totaling nearly $2 trillion in residential and commercial MSR valuations every month.
Residential MSR Market Update – July 2019
Author
Mike Carnes, Managing Director, MSR Valuations, Capital Markets Group
Mike.Carnes@miacanalytics.com