For the Q417, the MIAC GSA Conv_30 Index increased by 7.56% and GNII_FHA_30 index increased by 6.72%. During Dec 17, the GSA Conv_30 was up modestly 0.6% and GNII_FHA_30 up 0.64%. In larger GSA cohorts, which are actively traded in the MSR market, the Conv30_3.0_2016 increased by 5.34% and GNII_FHA_30 3.52%. Part of the price appreciation was attributable to more favorable economic conditions as well as tightening OAS spreads reflecting more aggressive investor appetite for MSRs. The Conv_30 OAS’s tightened 127 bps to 863 bps and GNII_FHA_30 OAS’s 164 bps to 1023 bps. These are significant OAS tightening, reflecting a measurable awakening of MSR bidders.
As measured by Bankrate®, month-over-month primary market 30-Yr conventional mortgage rates increased by three basis points to end the month of December at 3.85%. Quarter-over-quarter, 30-Yr conventional rates experienced a five basis point increase. While this amount of month-over-month mortgage rate movement may produce only a minimal upward shift in value, there was also an increase in benchmark earnings rates. From end-of-month November, the 5-Yr swap rate, which is the MSR market’s benchmark for earnings rates, increased by four basis points to end the month at 2.24%. Likewise, quarter-over-quarter the 24 basis point increase in the 5-Yr swap rate was in stark contrast to the quarterly change in the primary mortgage rate.
Other economic drivers and forward expectations also influencing MSR values are GDP, unemployment rate, inflation, and US manufacturing. According to the most recent forecast released at the Federal Open Market Committee meeting, GDP is expected to stay at a 2.5% growth rate in 2018 which is the same as 2017 but higher than the 2.1% growth rate in 2016. However, with the recent rally in equities and the year-end federal tax cut, the current market is expecting higher GDP growth than the 2.5% FOMC conservative estimate. Likewise, unemployment is expected to end 2018 and 2019 at 3.9%. While some may argue the unemployment rate is being partly affected by workers who are either underemployed or are working part-time hours when they’d rather be working full time, it is noteworthy to point out that unemployment is now at its lowest level since the 3.9% achieved in December 2000. It’s anticipated that inflation will be 1.9% in 2018. This compares to 1.7% in 2017 and 2.1% in 2016. Last, but not least, US manufacturing is expected to grow at a rate of 2.8% in 2018 which is faster than the economy as a whole.
So what does all of this mean for interest rates and MSR values? Higher, higher, and even higher! The Federal Open Market Committee raised the current fed funds rate to 1.5 percent in December 2017 and anticipate 3 more rate hikes in 2018. As illustrated in a graph sourced by the New York Fed and re-shared by the MBA. The chart clearly shows a downshift in the amount of MBS reinvestment activity over the last two quarters which is driving many economists to believe that mortgage rates may rise by as much as 75 basis points by the 4th quarter of 2018.
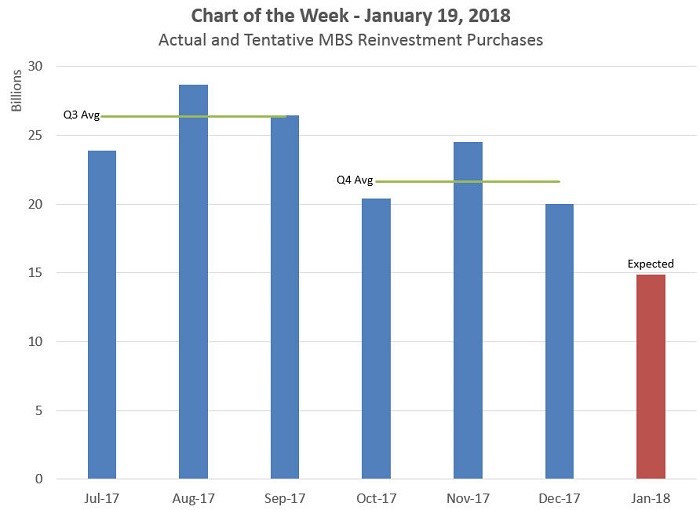
Figure 1: Actual and Tentative MBS Reinvestment Purchases Source: New York Fed and re-published by the MBA
With such a persuasive forecast which is being partly driven by recent tax legislation, and as evidenced by MIAC’s GSA (Generic Servicing Assets) the impact on MSR values have been nothing but positive. In just the fourth quarter of 2017, MSR values rose by as much as one-third of a multiple.

Figure 2: Period-over-Period Price Change by Product Source: MIAC Analytics
Lending further support to the above-referenced benchmarks, trading values witnessed on mostly larger pristine MSR offerings of Conventional 30-Yr 3.50% coupon and below were above and in some cases well above a 4.0 multiple.
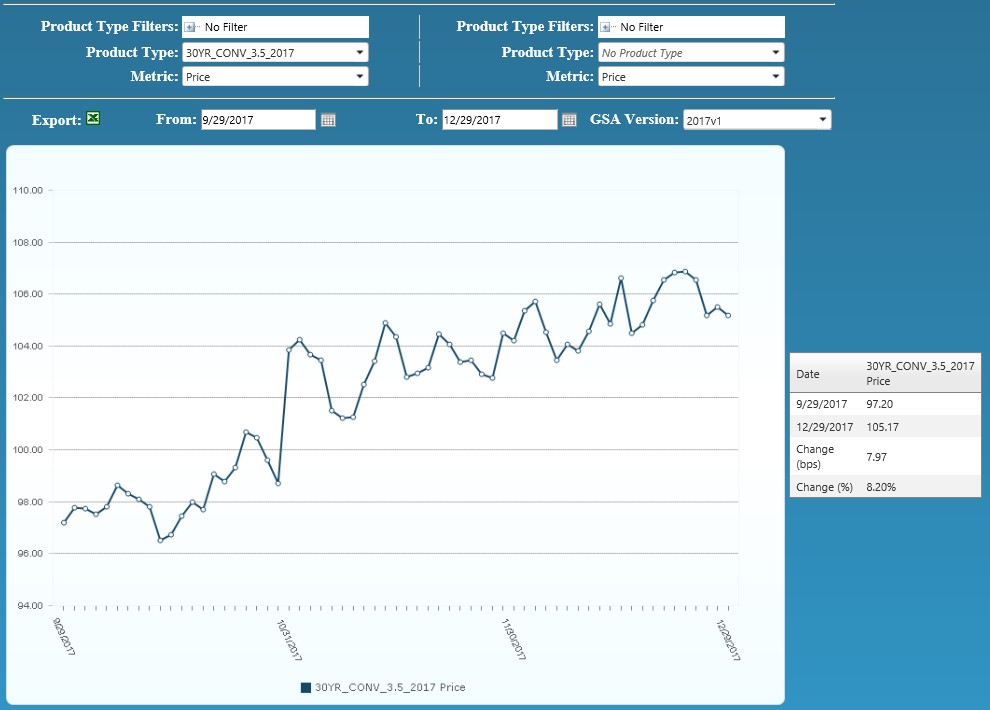
Figure 3: Conv 30-YR 3.50% 2017 GSA Index Source: MIAC Analytics
Counterparty net worth and the size of the offering continue to impact who bids and at what price but during December, “Conventional at-market multi-billion offerings” mostly experienced very respectable bids ranging from a 4.25 to “in isolated instances” north of a 4.50 multiple. Until now, there was a lot of buyer resistance at levels reaching a 4.50 multiple but with buyers increasingly optimistic about MSR’s the market has started to break through the mid 4 barrier. Naturally, to accomplish this level, bulk offerings need to have a sub 4.0% weighted average note rate with a heavy concentration of 30-year product. Furthermore, the deal must have sufficient economies of scale with an attractive footprint, and last but not least, it must be from a reputable counter-party.
Smaller conventional packages categorized as $500 million or less are seeing an uptick in trading volume as well but at prices that “on average” can be 5 to 15 basis points lower than the bid prices obtained on larger offerings.
Similarly, trading levels on mostly newer “at-market Ginnie Mae offerings” ranged in the mid 3 multiple range, but like before, are heavily influenced by service fee level, geography, deal size, borrower credit quality, counterparty, and potential exposure to recent storms, including hurricane and wildfires.
MIAC’s MSR Valuation department provides MSR valuation advisory services to over 200 institutions totaling nearly $2 Trillion in residential and commercial MSR valuations every month. Learn about MIAC’s industry-leading valuation, brokerage, and/or GSA benchmarking, and please reach out to your MIAC representative for more information.
Mike Carnes, Managing Director, MSR Valuations, Capital Markets Group
Residential MSR Market Update – January 2018