Year-Over-Year
To name a few, in 2018 we witnessed crashing equity prices, declining bond prices, and saw prepayment activity hit a 10-year low.
We also watched the devastation unfold due to natural disasters including hurricanes Florence and Michael in the East, and mudslides and wildfires in the West. For the cherry on top, on December 22nd we observed the beginning of a partial government shutdown with seemingly no end in sight. All in all, it sounds pretty dreadful, but not so in the case of MSRs.
Year-over-Year on an unleveraged basis MSR values were higher by 14.22% and this doesn’t include any added value due to cross-sell and/or recapture benefits. While lower December values came as unwelcome news for many and the timing was less than ideal especially for those that weren’t hedging their MSRs, we might reflect back to the beginning of 2018 when MIAC’s Conv_30 and GNII_FHA_30 index OAS’s respectively sat at 796 and 994 for a full-year 2018 tightening of 133.6 and 219.5 basis points.
Throughout 2018, many MSR portfolios reaped the benefit of steadily increasing short term rates which by the end of October resulted in a 5-Year Swap rate of 3.14% which was eighty-nine (89) basis points higher than where the 5-Year Swap rate closed at the end of 2017. Due to a tumultuous December, earnings rates witnessed a sharp end-of-year decline but still managed to end the year solidly higher at 2.57% for a year-over-year increase of nearly 33 basis points.
Many firms live in “Best-Ex” world where Cash-is-King but let’s not lose sight of the many benefits of MSRs including most notably the utilization of MSRs as a natural hedge. Even after December’s rally, end-of-year rates were still higher by a full sixty-six (66) basis points over end-of-year 2017 which when equated to value means that MIAC’s Conv_30 year-over-year index increased by 15.79 basis points and the GNII_FHA_30 index increased by 9.85 basis points. This resulted in MSR bulk execution deals trading at the highest prices in over a decade.
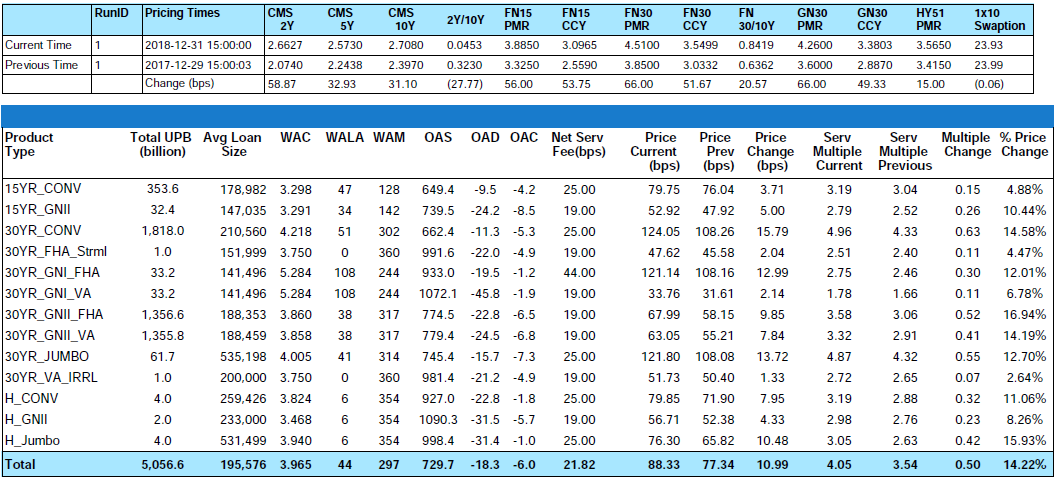
Figure 1: Year-to-Date Price Change by Product Source: MIAC Analytics
As part of our year in review, Basel relief was an often discussed topic that now looks as if it will have to continue into 2019. It has now been roughly one year since closing the comment period on a proposed capital relief plan designed to simplify risk-based capital rules and ease the compliance burdens placed on community banks. As a refresher, the proposed plan was as follows:
- Increase the cap on the amount of Mortgage Servicing Assets (MSAs) included in Tier 1 capital from 10% to 25%
- Eliminate the 15% cap on the amount of MSAs, Deferred Tax Assets and other assets included in Tier 1 capital
- Retain the Basel III 250% risk weighting for MSAs
While there has been some activity including the recent 4Q18 FDIC vote to release a proposal that would simplify the capital treatment for an estimated 80% of community banks, one year later, and despite growing pressure from the Mortgage Bankers Association and Independent Community Bankers of America, no final decisions have been made. Until a decision is made capital planning challenges will persist.
Month-Over-Month
From end-of-month November to end-of-month December, the MIAC Generic Servicing Assets (GSAs™) Conv_30 index decreased by 2.90% or 3.70 basis points and the GNII_FHA_30 index decreased by 7.22% or 5.72 basis points. The reason for the large disconnect between the changes in Conv30 vs. GN_II_FHA_30 value is twofold. MIAC’s GNII_FHA_30 cohorts contain 19 basis points of service fee thus escrow earnings represent a larger percentage of the MSR value as compared to MIAC’s Agency GSA cohorts at 25 basis points of service fee. Next and due to the higher percentage of escrowed borrowers, Ginnie Mae MSRs relative to their average balances often carry a higher average annual escrow percentage and are therefore more sensitive to significant adjustments in short term earnings rates.
One commonly used index for assigning float value is the 5-Year Swap rate. The ability to earn float revenue depends on numerous factors such as remittance type, when a borrower makes his/her payment when the loan pays off, and whether or not the borrower escrows their tax and insurance payments. Regardless, nearly all float balances carry a term that can range from zero days to 6 months vs. the longer 5-Year Swap. Still, the MSR market convention is to use a rate that better reflects the longevity of the MSR asset and whether that’s managed with a longer durated index or a shorter durated index with forward biasing, the end result should still be a supportable Fair Market Value.
Between end-of-month October and end-of-month November, earnings rates fell from 3.14% to 2.98%. To add insult to injury, the drop in base mortgage rates paled in comparison to December’s 5-Year Swap rate drop of 40.8 basis points for a close of 2.57% which for many was the largest driver of value during the month of December.
For the month, primary rates as reported by Bankrate® decreased by seventeen (17) basis points. While concerning in the context of the looming government shutdown and the extreme volatility taking place in the Dow Jones Industrial Average, this still puts numerous Servicers in the enviable position of owning MSR portfolios that are still 50 or more basis points “out-of-the-money”. While at current rate levels this still puts a damper on refinancing actively, it does (assuming rates stabilize), contribute some CPR stability for those fortunate enough to be servicing “out-of-the-money” MSRs.
In larger GSA cohorts which are actively traded in the MSR market, the Conv30_3.5_2016 and GNII_FHA30_3.5_2016 cohorts respectively decreased by 3.52% and 7.03%. During the month of December, Conv_30 Index OAS’s widened to close the month at 662.4 basis points for an increase of 66.4 basis points. Likewise, GNII_FHA_30 Index OAS’s widened to 774.5 basis points for a month-over-month increase of 75.2 basis points.

Figure 2: Month-Over-Month Price Change by Product Source: MIAC Analytics
MSR Transaction Activity
Recent “large” transactions which we define as deals containing $1 to $5 plus billion in unpaid principal balance have validated our very granular GSA prices. As for smaller offerings, the price/multiple spread is narrowing. Smaller offerings, defined as $500 million to $1 billion, are increasingly becoming the target of some larger buyers who have decided they’d rather not compete at the levels currently being offered for some of the largest offerings. Whether the transaction is large or small, one certainty is that most buyers are increasingly targeting pristine portfolios from well-capitalized sellers. While each buyer has their own definition of “thinly” capitalized or otherwise “at risk” counterparties, the sellers most apt to incur a price adjustment and/or fewer bids are those firms with a net worth less than $10 million.
The smallest packages categorized as $300 million or less in unpaid principal balance are trading at a robust pace too but at prices that “on average” range anywhere from 10 to 20 basis points lower than the bid prices obtained on larger offerings. In addition to the reduced economies of scale afforded by larger MSR trades, acquisition cost is one of the reasons that smaller deals can trade at a discount to larger offerings. The legal and due diligence cost that a buyer may incur to acquire a portfolio can influence how a firm might bid on a smaller trade. Even so, it is the smaller trades that can often create the largest margins and in a quest for margin, increasingly we see larger buyers bidding on smaller offerings but sometimes with a more rigid approach to price and term negotiations.
Regardless of size, not all bids are as they might appear on the surface. Differences in prepay protection periods, non-reimbursable advances, non-payment for assets that are 60 or more days delinquent, fee deducts for seriously delinquent MSRs, loan kicks, and possible set-up fees are just a few of the pitfalls that can quickly affect a seller’s net execution price.
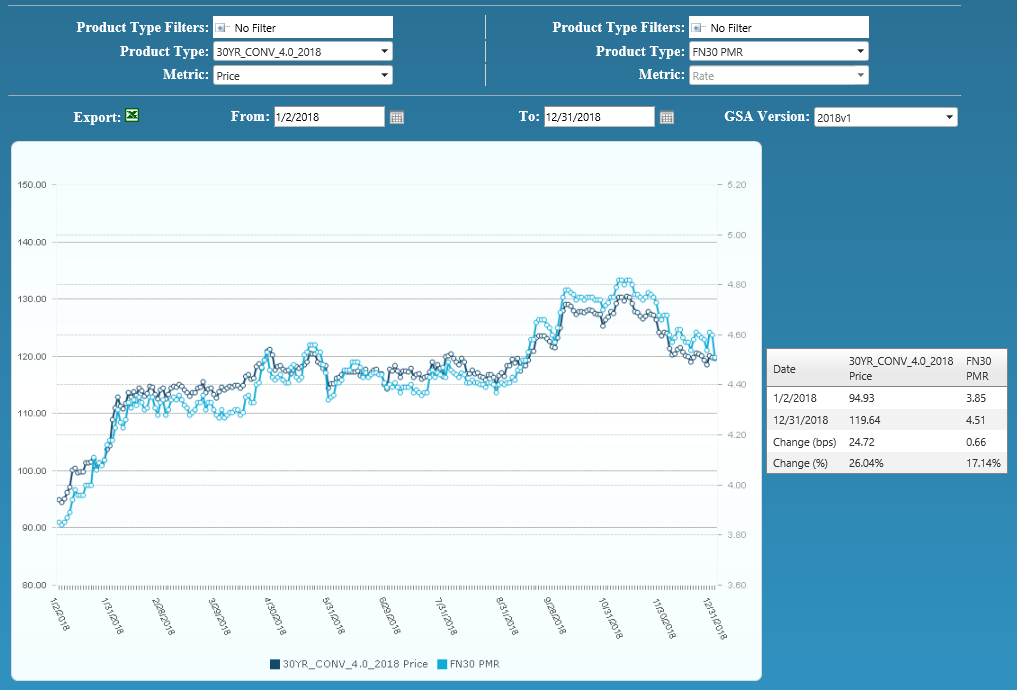
Figure 3: Year-to-Date Conv 30-YR 4.00% 2018 GSA Index Source: MIAC Analytics
MIAC’s MSR Valuation department provides MSR valuation advisory services to over 200 institutions totaling nearly $2 trillion in residential and commercial MSR valuations every month.
.
.
.
Residential MSR Market Update – December 2018
Author
Mike Carnes, Managing Director, MSR Valuations, Capital Markets Group
Mike.Carnes@miacanalytics.com