Month-over-Month
From end-of-month July to end-of-month August, the MIAC Generic Servicing Assets, (GSAs™) Conv_30 Index decreased by 7.45% and the GNII_FHA_30 index decreased by 12.96%.
In larger GSA cohorts, which are actively traded in the MSR market, the Conv30_3.5_2016 cohort decreased by 8.03% and the GNII_FHA30_3.5_2016 cohort decreased by 17.06%. During the month of August, Conv_30 Index OAS’s widened to close the month at 862.4 bps for an increase of 34.4 bps. Likewise, GNII_FHA_30 Index OAS’s widened to 1,060.7 bps for a month-over-month increase of 77.1 bps.

Figure 1: Month-over-Month Pricing Change by Product Source: MIAC Analytics™
Particularly for firms hedging their MSRs, utilizing a consistent approach for determining one’s primary mortgage rate is critical. Even so, don’t let the need for consistency cause your MSR values to be too rich or too cheap to benchmark trades. Bandwidth and the need to control volume through rates, not to mention one firm’s appetite for certain product types over another, can create havoc when comparing one survey or one rate sheet to another. As an example, look at the difference in Ginnie Mae rates between a National Bank and a Non-Bank and it’s easy to see what I’m talking about. Depending on the benchmark, firms may produce a completely different outlook on prepay speeds. That’s why it’s so important that firms look at more than one benchmark just to ensure its consistency with other leading indicators.
For clarification, MIAC’s Primary 30-year Mortgage Rate (PMR) relies on the underlying 10-year Swap Rate plus a nominal mortgage spread. As referenced above, sole reliance on a single PMR benchmark or constant spread can be dangerous. Some of the most common PMR benchmarks include but are not limited to Bankrate, Freddie Mac Weekly Survey Rate, Eikon Survey, and Mortgage Rates Daily. As an example of why validation is key, take for instance how Bankrate® is calculated. Bankrate’s daily survey collects rates from the previous day from mostly large lenders in all 50 states. Bankrate.com site averages can be volatile as the institutions included in the survey are often different from one day to the next depending on which institutions’ rates Bankrate can gather on any particular day. While historically most benchmarks are very accurate, the most critical element is that a firm’s final MSR value needs to reside in a tight range of benchmark trades. The reality is that firms don’t always vary their OAS, discount rate, or base cost to service on a monthly basis. What does vary monthly are speeds and what drives voluntary speeds is “In-the-Moneyness”. Considering what can be 20 bps or more variance between some of the leading PMR benchmarks, no matter what benchmark gets utilized, having the ability to apply more or less spread is key.
The end result for MIAC was a PMR decline of (28) twenty-eight basis points to 3.59% and a rate that falls within a 10 bps range of commonly used primary mortgage rate benchmarks.
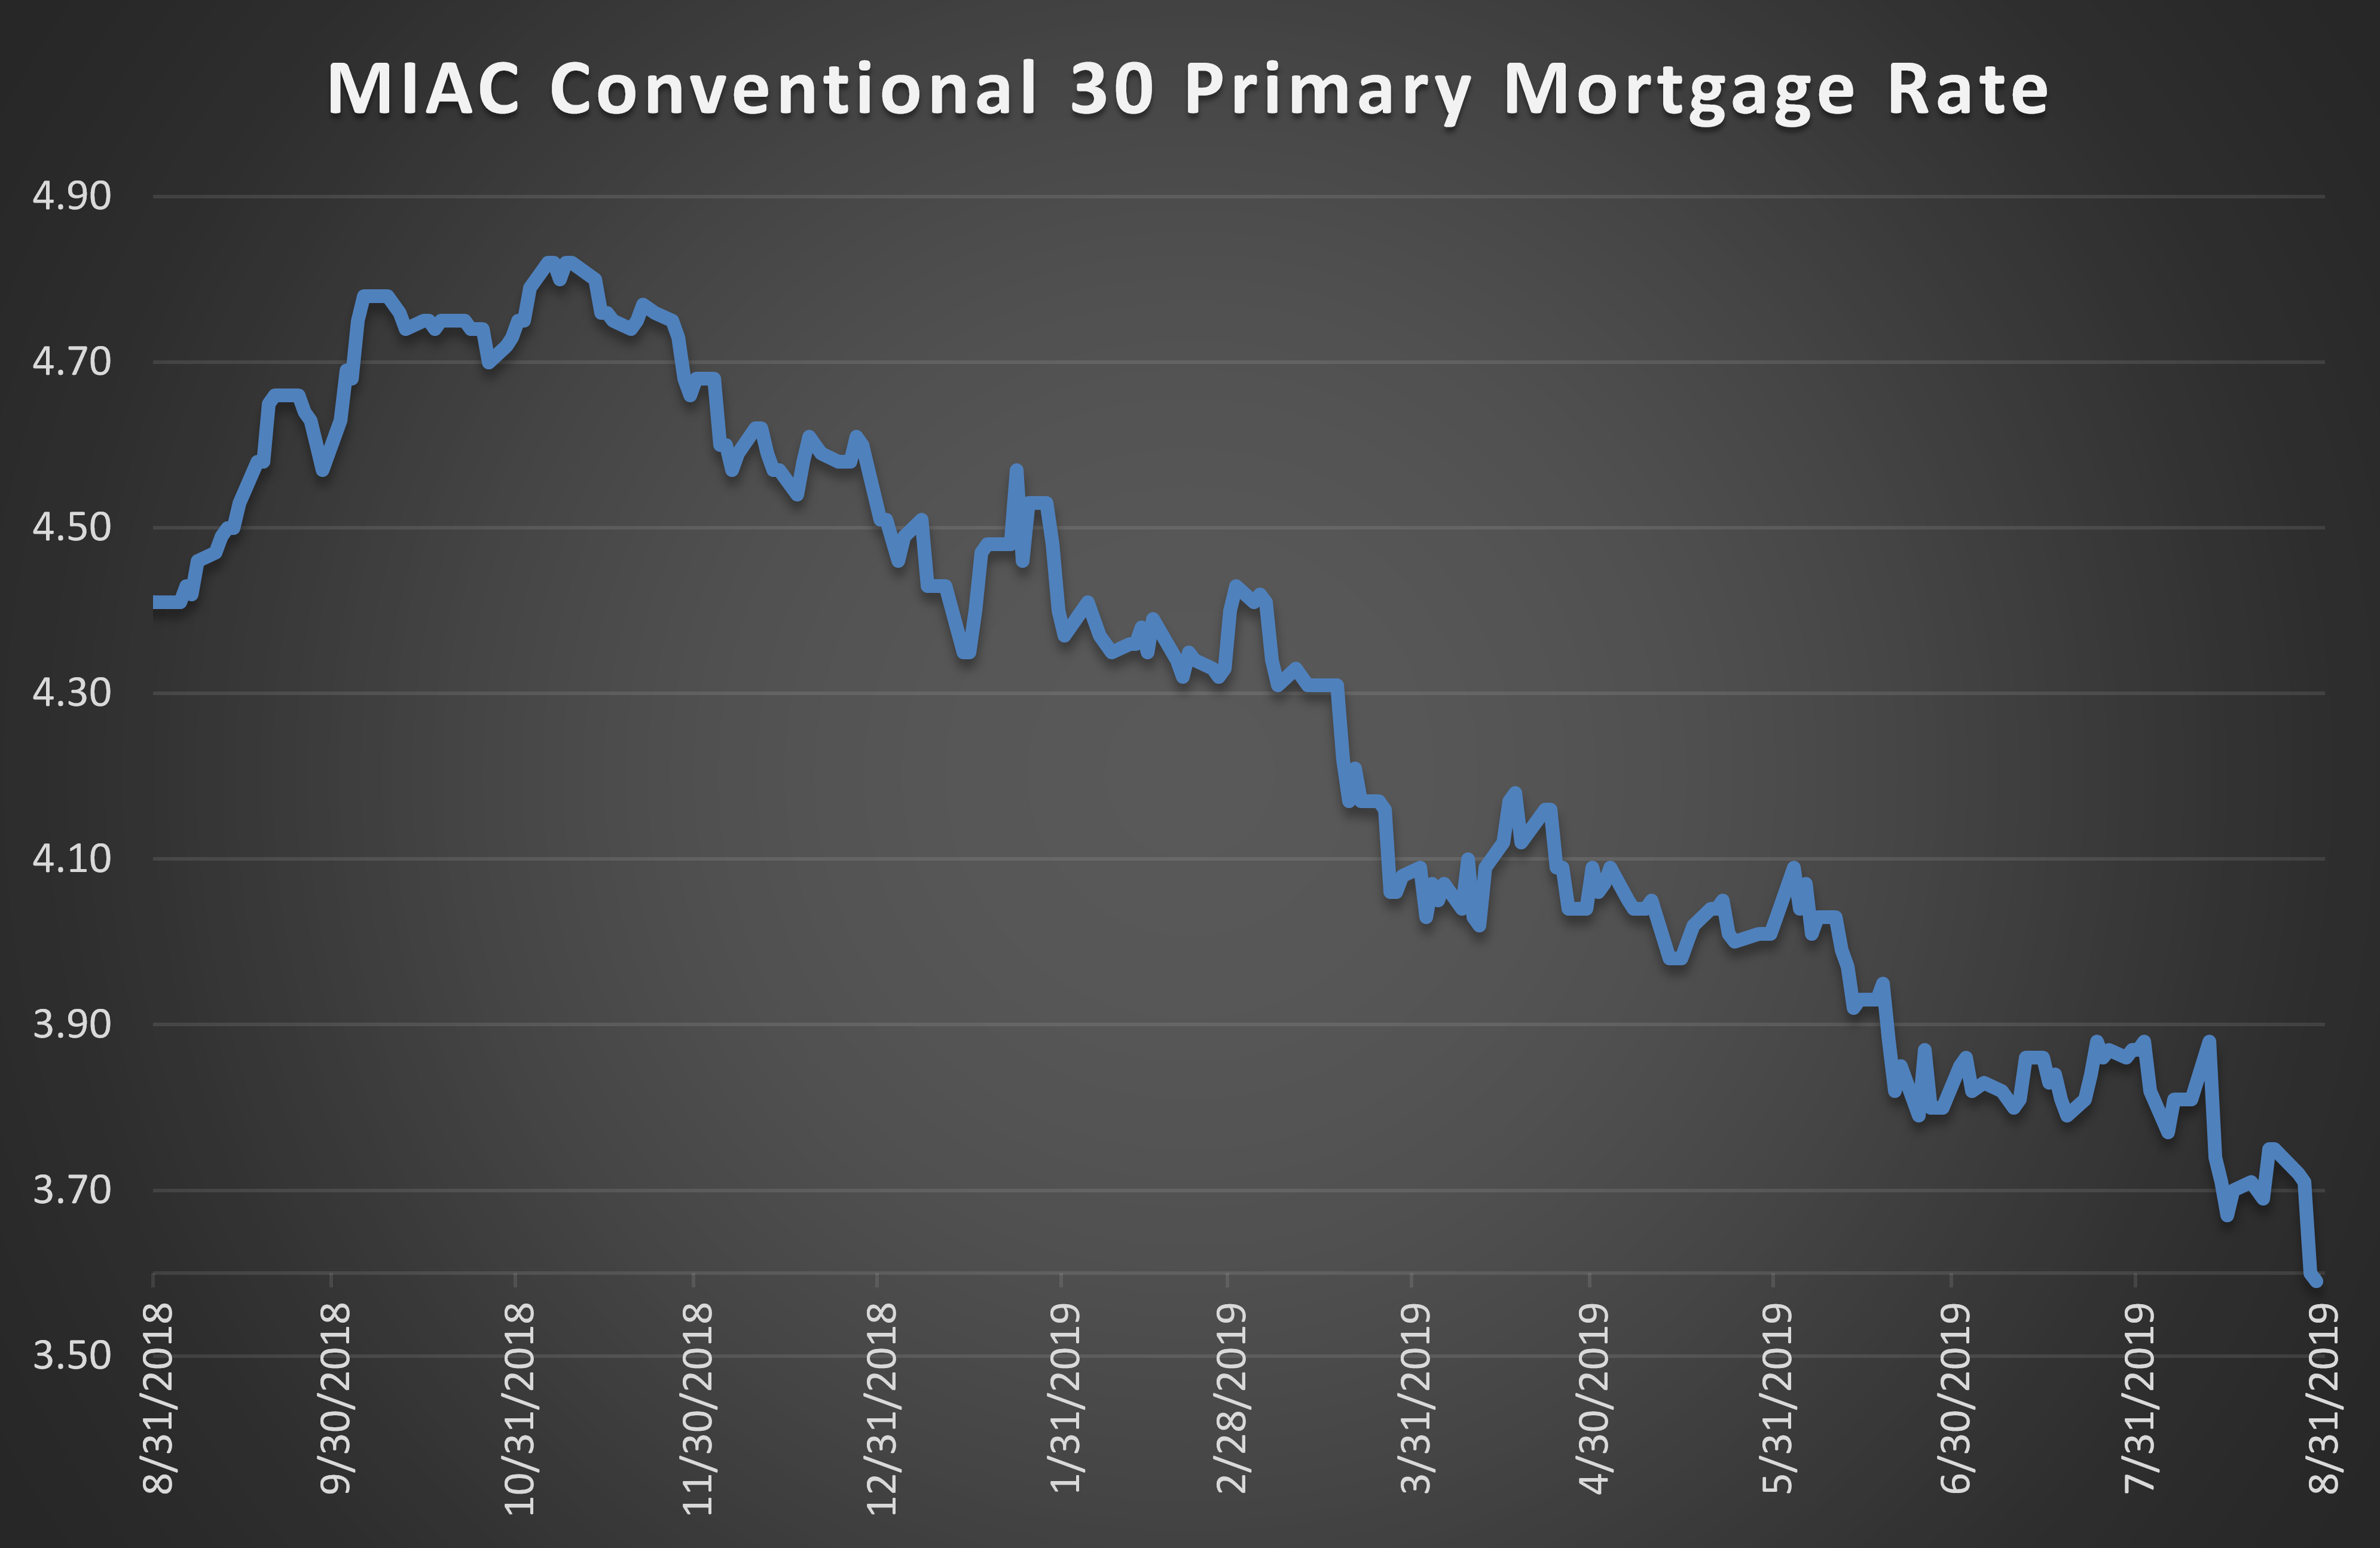
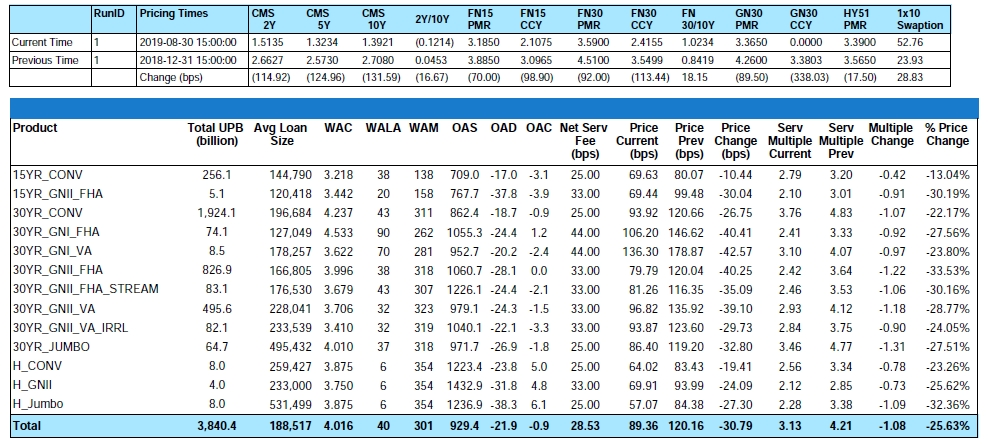
Figure 2: Year-to-Date Price Change by Product Source: MIAC Analytics™
Prepayment News
A key indicator of future payoffs is the MBA refinance application index which despite a recent cooldown, is in support of higher day count adjusted prepay speeds over the months of September and October. This may come as unwelcome news to servicers who nationally experienced a CPR of 17% on Fannie Mae 30-year MBS in the month of August which as anticipated was 5-10% higher month over month. As in prior months, the fastest prepaying Agency cohorts were the 4.0% 2018 vintage pools which prepaid at a 32 CPR for Fannie Mae and a 46 CPR for Ginnie Mae II MBS. Globally speaking, it’s unfair to categorize FHA and VA into the same category when discussing CPRs. For example, for certain 2018 vintage cohorts, VA borrowers have been prepaying on average 30% faster than FHA borrowers which by default is shifting the shape of the aging curves between FHA and VA.
Recapture: To include or not
The conundrum for many in the Fair Market world right now is to include or not include recapture into a Fair Market Value. Per GAAP, the inclusion of recapture is strictly forbidden. The problem is this – per GAAP, it’s also a requirement to benchmark values to observed trades and to be competitive on deals of $5 billion and greater, for certain transactions it’s a virtual mandate that buyers directly or indirectly include recapture into their bid price in order to be competitive. Once it becomes an observed trade, also per GAAP, we’re to benchmark to those observed trades.
Just to lend some clarity to this discussion, a portfolio prepaying at 15% annually with a 1% gain on sale margin and a recapture rate of 20% can produce an additional 10 basis points in economic benefit or roughly 2.5 bps for every 5% of recapture recognized.
While ill-advised, to avoid detection, some will lower their discount rates and/or their CPRs to simulate the same desired outcome. They do this by reporting a CPR net of recapture. While not all large firms do so, it is the firms with $5 billion or greater in servicing that have the greatest tendency to include some form of recapture into their GAAP results. Given the availability of observed trades that include recapture, multiple audit firms are becoming increasingly receptive to its inclusion.
On the list of why firms might exercise some caution, there are only a limited number of buyers that regularly include recapture as part of their bid prices. If those buyers would stop buying or stop including recapture into their bid prices, it could leave anyone benchmarking to those trades exposed. As previously referenced, a firm may discontinue paying up for recapture when/if bandwidth creates more volume than a firm is equipped to handle. Anyone believing that their ability to recapture may be compromised due to capacity constraints is not likely to include as much or any recapture benefit into their bid prices.
For anyone contemplating direct or indirect inclusion of recapture into a Fair Market value, it’s wise that they first approach their auditors with a detailed history in support of their actual recapture experience and be able to defend those results against recent benchmark trades.
MSR Transaction Activity
Despite 30-year mortgage rates being at their lowest level since 2016 and refinance fever sweeping across the US, numerous MSR packages were auctioned during the month of August. While deals of $1 billion and less slowed to a mere trickle, numerous offerings of $8 billion and greater hit the auction block this month. The distinction between the deal sizes is that “most” larger offerings can command prices that include a portion of the recapture economics. Of late, lower rates (which initially began their rally in mid-November), and the resulting impact on modeled MSR values means that fewer numbers of servicers are either required to sell because of increased origination volume and resulting gain on sale “or” want to sell out of fear for a potentially lower execution. For those that do sell, reasons may include capital constraints, avoidance of a potential margin call, or simply that some firms wrote the assets down at a faster pace and as a result are able to sell at a higher price than their current holding value.
In recognition of stiff competition for fewer MSR packages “large” transactions which we define as deals containing $1 to $5 plus billion in unpaid principal balance continue to validate our very granular GSA prices. As for smaller offerings, the price/multiple spread is narrowing. Smaller offerings defined as $500 million to $1 billion are being targeted by increasingly higher numbers of “Large” transaction buyers. While not always the economies of scale that they want, evidence shows that certain large buyers with excess capacity will gladly purchase a small deal rather than no deal at all.
The smallest packages categorized as $300 million or less in unpaid principal balance are trading at a robust pace too but at prices that “on average” range anywhere from 10 to 20 bps lower than the bid prices obtained on larger offerings. In addition to the reduced economies of scale afforded by larger MSR trades, the acquisition cost is one of the reasons that smaller deals can trade at a discount to larger offerings. The legal and due diligence cost that a buyer typically incurs to acquire a portfolio can influence how a firm might bid on a smaller trade. Even so, it is the smaller trades that can often create the largest margins and in a quest for margin, increasingly we see larger buyers bidding on smaller offerings but usually with a more rigid approach to price and term negotiations.
Regardless of size, not all bids are as they might appear on the surface. Differences in prepay protection periods, non-reimbursable advances, non-payment for assets that are 60 or more days delinquent, fee deducts for seriously delinquent MSRs, loan kicks, and possible set-up fees are just a few of the pitfalls that can quickly affect a seller’s net execution price.
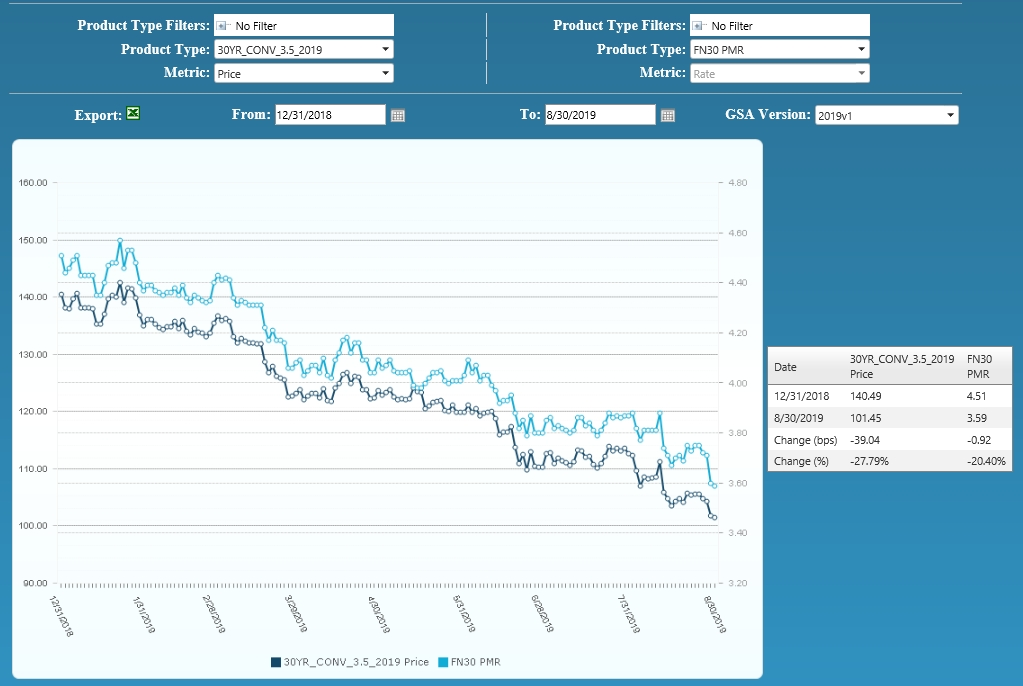
Figure 3: Year-to-Date Conv 30-YR 3.50% 2019 GSA Index Source: MIAC Analytics™
MIAC’s MSR Valuation department provides MSR valuation advisory services to over 200 institutions totaling nearly $2 trillion in residential and commercial MSR valuations every month.
.
Residential MSR Market Update – August 2019
Author
Mike Carnes, Managing Director, MSR Valuations, Capital Markets Group