Introducing MIAC’s “Research Insights” series: designed to be both short and topical. Your feedback is essential and we welcome comments on existing articles as well as suggestions for future ones.
Measuring Credit Outcomes
There are numerous ways to quantify credit outcomes – each of these metrics have their strengths and weaknesses. However, for purposes of valuation, risk management, and scenario analysis, it is essential to estimate credit transitions.
These are also commonly referred to as roll rates, and we use the terms synonymously. Transition rates are defined by the “from” status and the “to” status. For example, the fraction of loans that end up as 30-day delinquent (hereafter, D30) at the end of a given month relative to the number of loans that were current at the start of the month is referred to as the “current to D30” monthly transition. We’ll use the following notation “C->D30” to refer to these transition rates – which can be either historical realizations or model-based probabilities. In this setting, the fundamental unit of analysis is a loan/month, rather than a loan. This transition approach is equally applicable to both MSRs MSRs (where the primary concern is delinquencies and the need to advance; loss severities are secondary) as well as to whole loan valuation (where the primary concerns are cumulative liquidations and loss severities). In a forthcoming Research Insight, we’ll explain the reasoning behind this assertion, describe how these transition rates are integrated into our analytics platforms, and show how clients can access and dial them.
Figure 1 shows the C->D30 rate by sector across observation periods. These data points are from the GNMA MBS Loan Level Disclosures and go back to 2013. This figure shows that FHA C->D30 rates are substantially higher (roughly 1.8x) than VA C->D30 rates, and this holds across all observation periods.
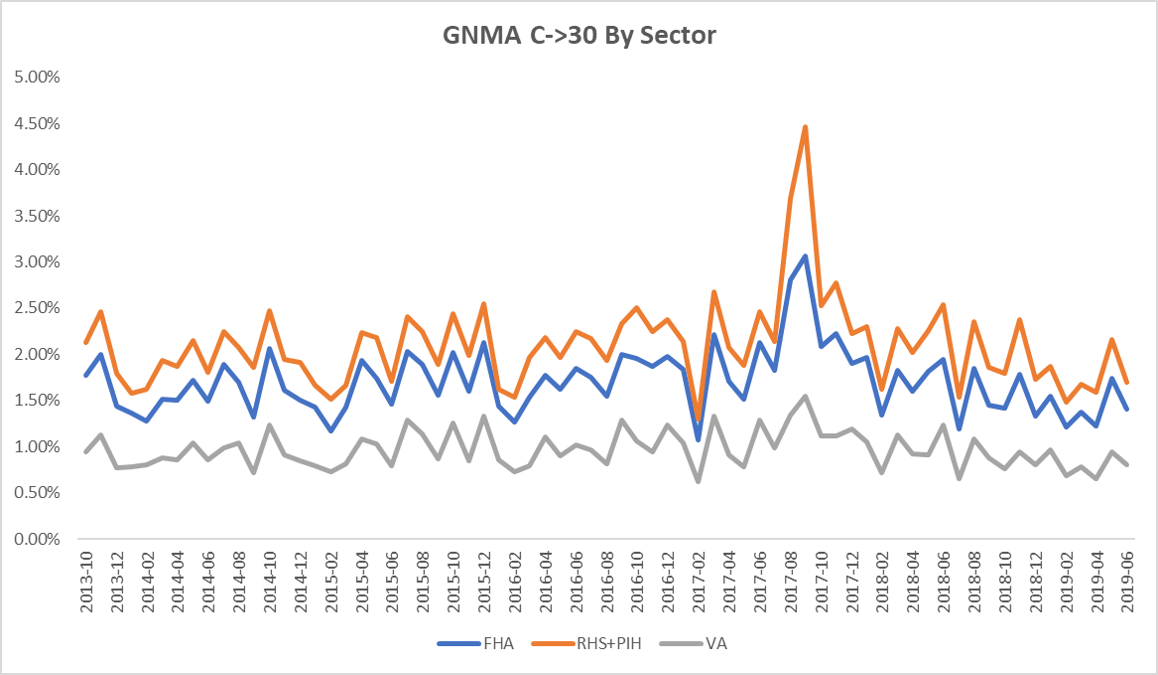
Figure 1: C->D30 rate by sector across observation periods Source: MIAC Analytics™
Is this substantial FHA/VA performance disparity explained by observable borrower, loan, property, and economic attributes? Figure-2 suggests that this is indeed possible, since most VA credit drivers are substantially better than FHA credit drivers.
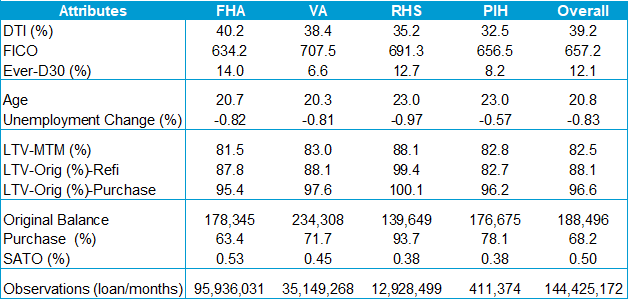
Figure 2: VA Credit Drivers Source: MIAC Analytics™
FHA Loans are Worse Even After Controlling for Characteristics
Do the worse characteristics of FHA loans fully explain their weaker credit performance? In order to address this important question, we need a statistical model that relates the probability of a C->D30 transition to observable loan-level characteristics. We have estimated and implemented models for all relevant transitions in our CORE-5.1 model, which is available in our WinOAS™ platform. For each transition – including the C->D30 transition under discussion here – we estimated a generalized logistic model using the GNMA loan-level data described above. By generalized logistic, we mean that raw explanatory variables are transformed as needed to achieve the necessary behavioral response profile. In subsequent articles, we’ll delve into our model development process and explanatory factors in more detail.
Our most important finding is that, even after adjusting for their worse observable characteristics, FHA C->D30 rates are, on average, 1.3x higher than VA C->D30 rates. We say “on average” because, in a probabilistic model, the impact of any attribute depends upon the levels of other attributes. In other words, about 62% of FHA underperformance can be explained by their worse characteristics (i.e., 1.8-1.3/0.8) with 38% unexplained (i.e., 0.5/0.8). We did some sensitivity testing and found that this conclusion is robust to the details of the model specification. Further, the weaker attribute-adjusted performance of FHA versus VA has been documented by other researchers using alternative datasets and methodologies (see, for example, Goodman et al [2014])¹.
The reason for this disparity is that VA loans have, on average, better unobserved characteristics, and Goodman et al outline a number of possibilities, such as the VA Residual Income Test, VA Servicing Practices, the Military Culture, and so on. The list of potential unobserved characteristics is endless, and may well include more adverse down payment assistance in the FHA sector, a higher percentage of thin credit files, lower reserves, higher payment shock from the prior loan, etc.
Another way to visualize the impact of sector and the importance of better VA observed characteristics is to display segmented model fits versus some important credit attribute. Figure 3 shows model fits versus FICO score – one of the most important drivers of mortgage credit. It is evident that our CORE-5.1 model captures the impact of FICO very well for both sectors. At every level of FICO, FHA performance is worse than VA performance.
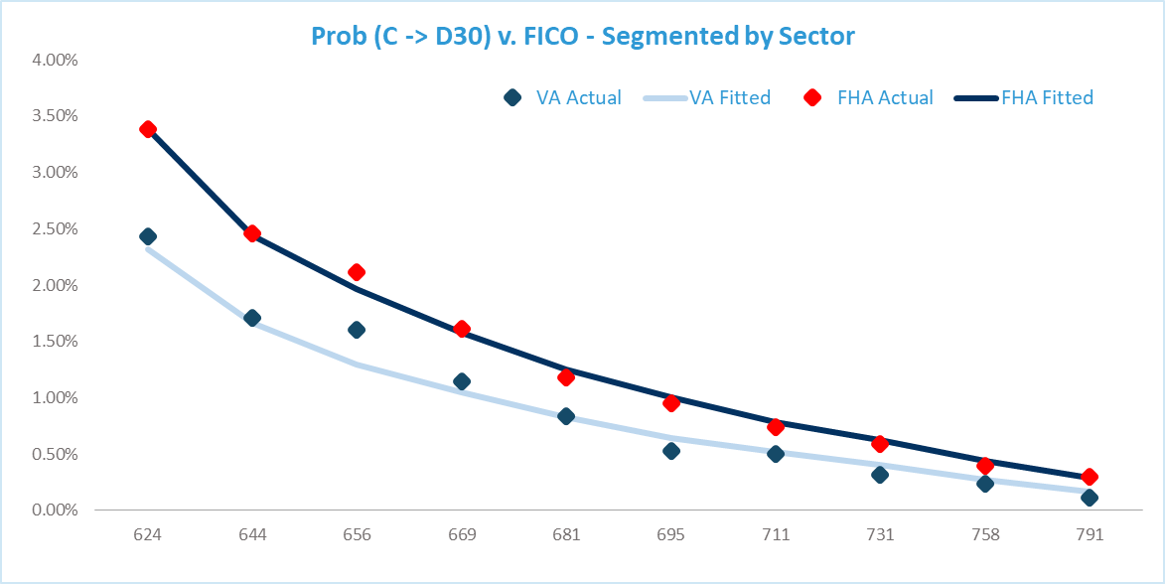
Figure 3: Prob (C -> D30) v. FICO—Segmented by Sector Source: MIAC Analytics™
GNMA Credit Models Should Include the FHA/VA Mix
Sector is a very important credit attribute readily available to clients, and it should be used when assessing credit risk. GNMA credit models which ignore the impact of sector are misspecified and cannot be relied upon for accurate projections.
.
Research Insights: Credit Risk in GNMAs – October 2019
Author
Dick Kazarian, Managing Director, Borrower Analytics Group
Dick.Kazarian@miacanalytics.com
¹ Goodman, Seidman, and Zhu, 2014, Urban Institute, “VA Loans Outperform FHA Loans. Why? And What Can We Learn?”
Read this month’s MSR Market Update