The bond market’s New Year’s resolution of not giving into stock pressure has not yet come to fruition, as yields continue to follow stocks lead.
The partial government shutdown has been going on for over a month with no definitive ending in site. US international trade relations have been shaky but recent headlines have markets feeling optimistic. The Fed’s recent tone sounds more dovish and less hawkish on the back of strong jobs data.
The partial government shutdown is the longest in the history books as we pass 30 days. Roughly 800,000 federal workers have not received a paycheck since December and many have started to file for unemployment benefits to cover normal living costs. Workers will miss their second paycheck if a deal is not reached by Friday (1/25/2019). Borrowers that have applied for FHA or USDA loans may notice closing delays and possibly cancellations for USDA loans in process. VA loans are not feeling the effects as the shutdown does not include “home loan processing”.
Optimism has stocks rallying as a recent report from Bloomberg said China offered a large concession that would eliminate the trade surplus by 2024. It remains to be seen if this means diverting purchases from other countries to the US. Any new issues could easily reverse the current stock trend. As shown in the chart below, bonds yields have been increasing (prices dropping) as stocks rally. 10-Yr yields ended the week of 1/18/2019 at a monthly high of 2.786 and the 2-10 spread wider at 17.
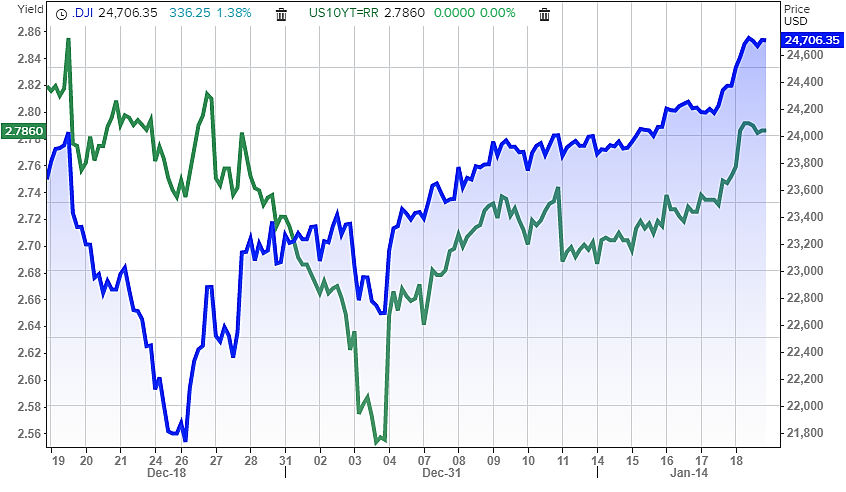
Figure 1 Source: Thompson Reuters
Yield Curve
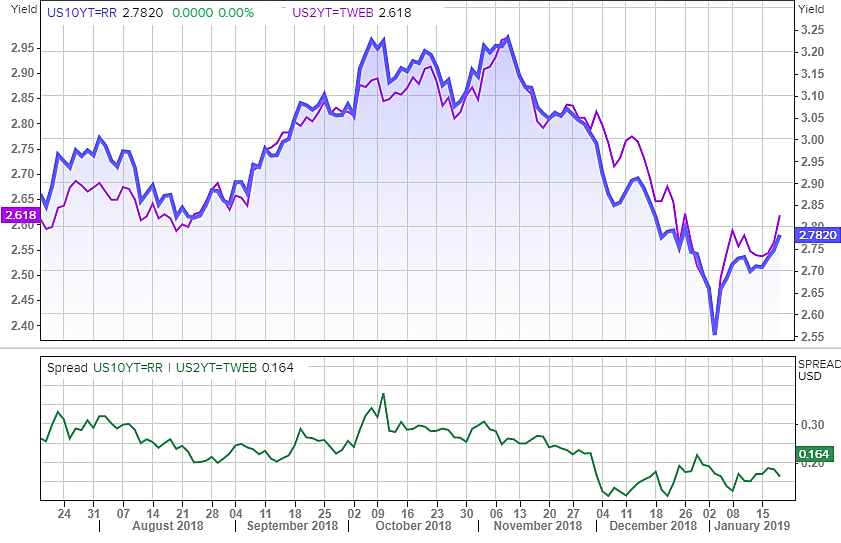
Figure 2 Source: Thompson Reuters
The upper chart compares the movement of 2-Yr and 10-Yr yields over the past six months. The lower chart shows the spread between the two yields during that period.
The yield curve remains one of the most highly watched economic growth indicators as it reflects the difference between shorter and longer-term US borrowing rates. The relationship between 2-Yr and 10-Yr Treasury yields is what most associate with the yield curve. The difference between the two yields is referred to as “spread”. The action of these two yields moving closer is referred to as “flattening”. As the spread tightens the curve flattens. The curve tightened as low as 9.2 on 12/4/2018; the lowest level seen since 2007.
The flatter the curve gets, the more markets become concerned. In the past, an inverted yield curve (short-term interest rate yield more than long-term interest rates) has preceded a recession. But, there could be another explanation offering less gloom and doom. The Fed has been increasing the fed funds rate for the past two years. The fed funds rate affects short-term rates (2-Yr) directly while having little impact on longer-term rates. 10-Yr bonds are highly traded on a global level which means they are affected by geopolitical and economic instability. 10-Yr Treasury bonds are considered a haven. During times of uncertainty increased demand causes rates to fall. Market movement over the past few years also supports this explanation.
Non-Farm Payrolls
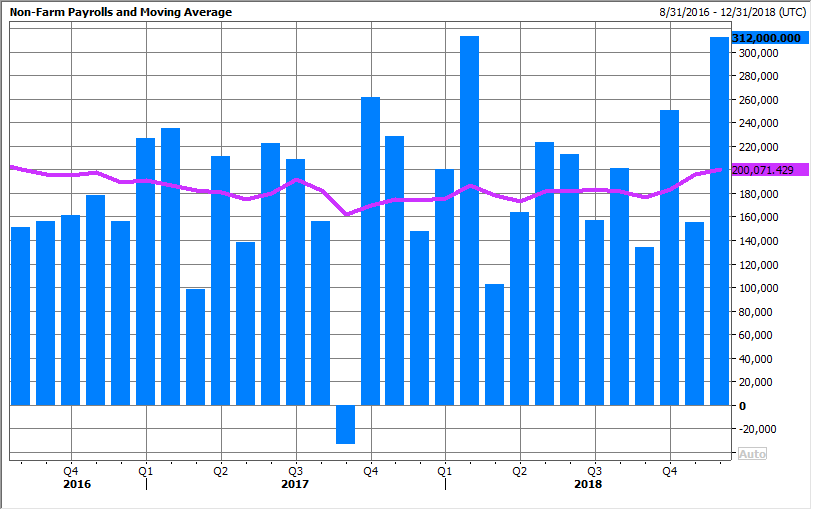
Figure 3 Source: Thompson Reuters
December Non-Farm Payrolls shattered forecasts of +177k gain by coming in at +312k. January Non-Farm Payrolls are set to be released February 1, 2018, with current forecasts near 183. It remains to be seen what if any impact the government shutdown will have on the upcoming results.
TBA Market
Throughout most of 2018, mortgages were a step behind 10-Yr Treasury yields as markets improved. This began to change towards the end of the year amid huge stock losses. The tide has since turned, and stocks are once again gaining, dragging 10-Yr yields to their highest point of 2019. On the plus side, FN30 4’s and G230 4’s remain well above their 100-day moving averages with GN outperforming in the lower coupons. The spread between G230 4 and FN30 4’s in Feb is 50 bps (up in GN’s). Moving up the coupon stack, the spread at 4.5% is 7bps (up in FN’s) and 70bps at 5% (up in FN’s). The compression in the higher GN coupons can mostly be attributed to the faster VA prepayment speeds. We are currently in a slow rising rate environment and where rates go from here depends on economic data, fiscal policy, and stock market movement.
FOMC Meeting and Fed Funds Rate
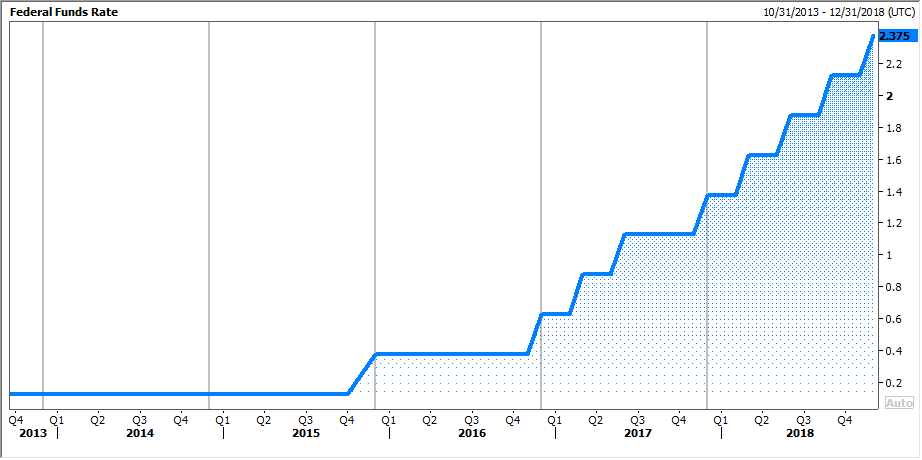
Figure 4 Source: Thompson Reuters
The most recent FOMC minutes, released on January 9, 2019, had a more dovish tone, as emphasis was put on data dependency, flexibility, and patience. While the Fed still expects two more rate hikes in 2019 markets are currently only pricing in one. The next release is on January 30, 2019, and no increase is expected at that time. Investors will be listening for any change in rhetoric or timing of future hikes. A more hawkish tone would almost certainly cause increased market volatility.
Upcoming Data Releases
The government shutdown recently delayed important data releases such as Retail Sales and Housing Starts. The chance of market volatility over the next two weeks is high as important inflationary and jobs data is released. Key market data releases for the next two weeks are listed below. One of the most watched and anticipated events is the FOMC minutes on Wednesday, January 30, 2019, where traders will be looking for clues to future interest direction and any effects from the government shutdown. The jobs reports on Friday, February 1, 2019, is the other major event with all eyes on Average Earnings and Non-Farm Payrolls.
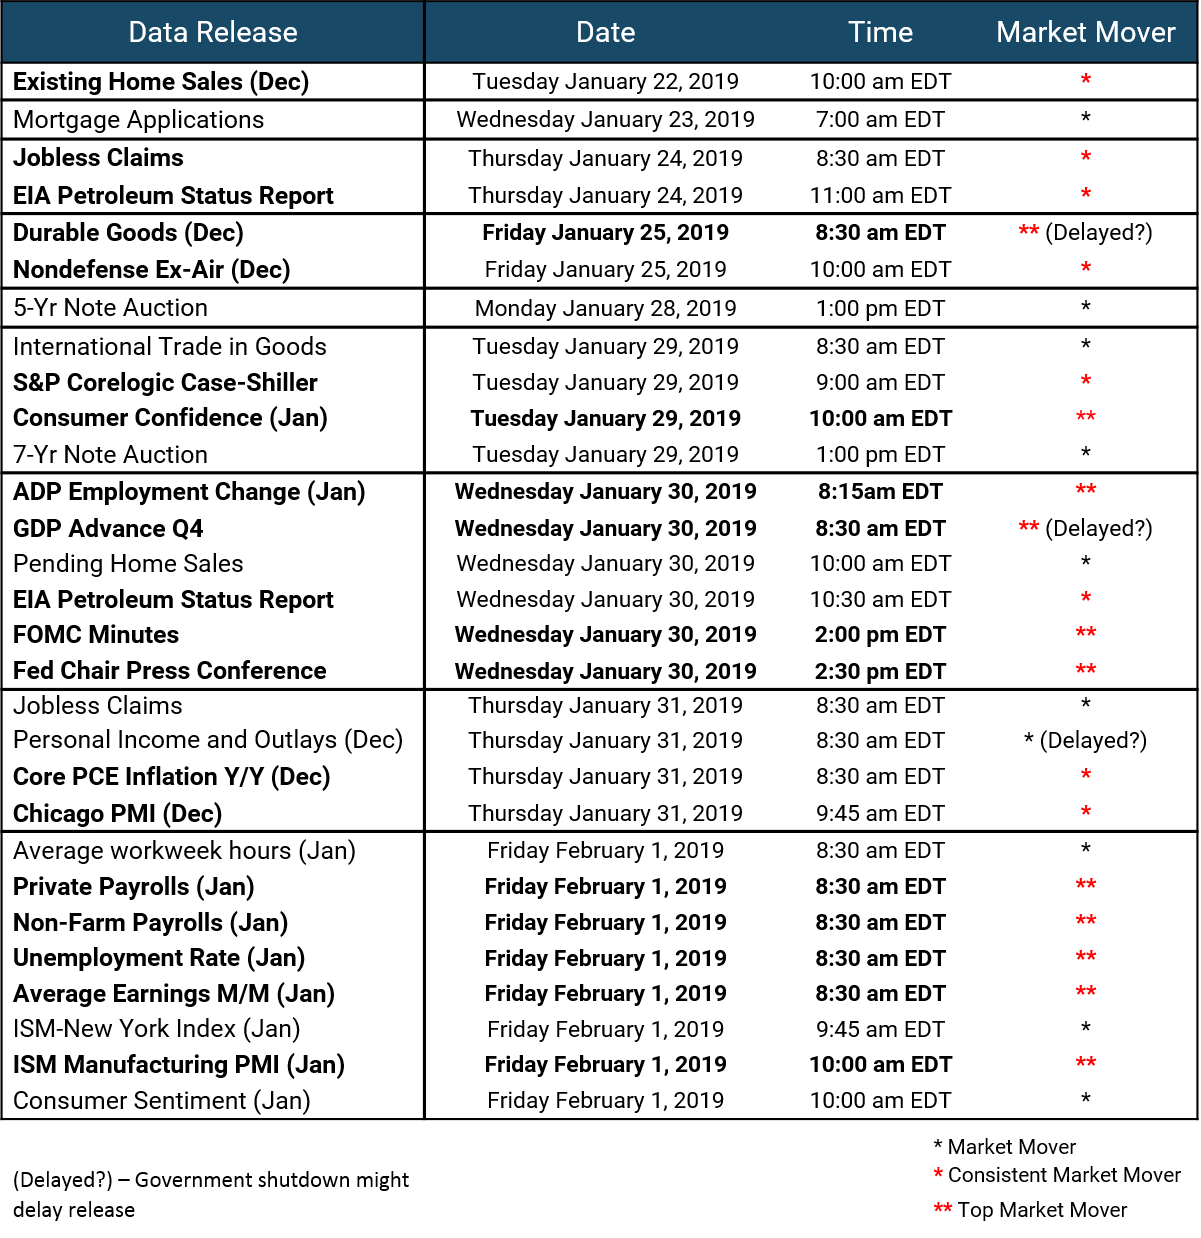
Figure 5 Source: MIAC Analytics
.
.
.
Secondary Markets Commentary – Week of January 21, 2019
Author
Justin Deaver, Account Manager, Secondary Solutions Group
Justin.Deaver@miacanalytics.com