Month-over-Month
From end-of-month May to end-of-month June, the MIAC Generic Servicing Assets, (GSAs™) Conv_30 Index decreased by 5.37% and the GNII_FHA_30 index decreased by 12.53%.
In larger GSA cohorts, which are actively traded in the MSR market, the Conv30_3.5_2016 decreased by 5.53% and the GNII_FHA30_3.5_2016 cohort decreased by 17.66%. During the month of June, Conv_30 Index OAS’s widened to close the month at 854.0 bps for an increase of 55.5 bps. Likewise, GNII_FHA_30 Index OAS’s widened to 1,026.4 bps for a month-over-month increase of 131.4 bps. The larger decline in Ginnie Mae value reflects the increased trepidation among buyers due to the fact that Ginnie Mae MBS continues to prepay faster than conventionals across the entire coupon stack.
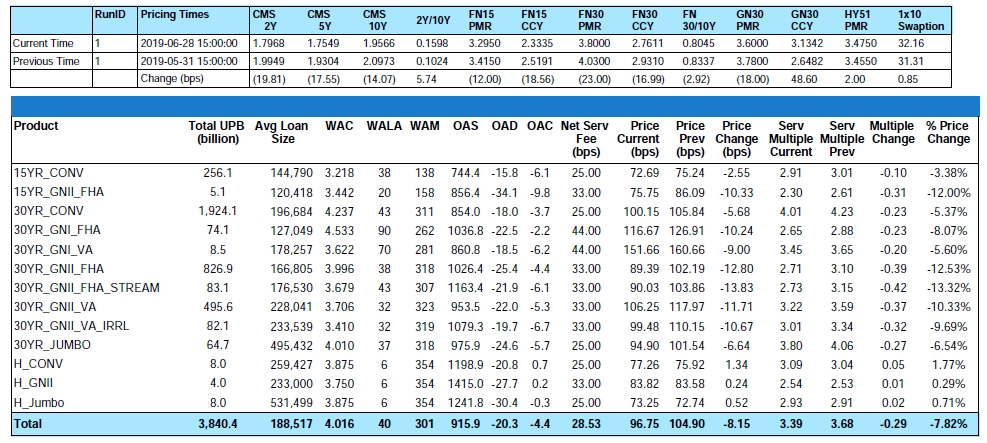
Figure 1: Month-over-Month Price Change by Product Source: MIAC Analytics™
As a reminder, option-adjusted spread (OAS) measures the spread between an MSR and the risk-free (Libor/swap curve) rates and properly measures how the embedded homeowner’s prepayment option is likely to respond to changes in future rate environments. Some servicers often rely on a constant OAS approach for determining their fair market value. With some OAS’s widening over 130 bps, this “mark-to-model” approach drifts away from a more empirically justifiable and defendable method which is to measure against actual MSR trades. Our valuation method is clearly a GAAP compliant Mark-to-Market value.

Figure 2: Year-to-Date Price Change by Product Source: MIAC Analytics™
Prepayment News
During the month of June 30-year conventional MBS experienced a 12.8% annualized CPR which was slightly lower than May partly because of a 2-business day reduction in the day count. As previously referenced, Ginnie Mae TBAs continue to prepay faster than conventional MBS. As an example, during the month of June, 4.5% coupon 2018 vintage Ginnie Mae II experienced a 35% annualized CPR vs. 25% for similar coupon Fannie Mae TBAs.
Looking ahead, servicers should experience a significant increase in July/August prepay speeds due to a continued decline in mortgage rates and a 50% month-over-month increase in refinance applications. Largely driven by lower mortgage rates, prepayments have more than doubled in the last four months resulting in the highest amount of refinancing activity since the Fall of 2016. Leading the way, 2018 vintage borrowers are seeing sub-4% mortgage rates for the first time and based on the 300% four months increase in CPRs, appear to be taking full advantage of the opportunity. In total it’s estimated that over 8 million homeowners with mortgages (including 1.5 million 2018 vintage borrowers) could now benefit from and likely qualify for a refinance. In previous years HARP provided a significant boost to a homeowner’s ability to qualify but due to sustained house price appreciation (annualized 3.4% over the last 3 months), an estimated 44 million homeowners have more than 20% equity in their homes making refinance an even greater possibility.

Concerns about global growth and ongoing trade disputes have pushed long-term interest rates lower resulting in mortgage rates seeing their lowest level since December of 2017. From end-of-month May to end-of-month June, Bankrate® was lower by twenty-three (23) basis points to end the month at 3.80%. Due to the ongoing volatility and widening Primary/Secondary spreads, servicers should exercise some caution when it comes to any sole reliance on a single benchmark. While consistency (particularly for firms hedging their MSRs) is critical, we’re seeing an increasingly diverse range of opinions on what constitutes a primary rate not to mention sometimes extreme day-over-day volatility. Servicers that rely on a secondary rate plus a spread must be mindful of widening and tightening spreads and servicers reliant on a single benchmark primary would be well served to look at more than one benchmark just to ensure its consistency with other leading indicators.
Ongoing market volatility caused both Freddie Mac and the MBA to respectively revise their average 2019 30-year fixed-rate mortgage estimate from to 4.1% and 4.0%. On a more positive note, even though MSR values are trending lower, at least we have more of it to value. On the latest June forecast report, Freddie Mac revised their full-year origination forecast to $1.774 trillion and the MBA to $1.737 trillion. This is up from roughly $1.6 trillion in 2018.
MSR Transaction Activity
Mostly attributed to lower rates (which initially began their rally in mid-November) and the resulting impact on modeled MSR values, fewer numbers of servicers are either required to sell because of increased origination volume and resulting gain on sale “or” want to sell out of fear for a potentially lower execution. The most common reasons for selling today are:
1) The seller may believe that values have more room to fall.
2) The seller has the MSRs levered and are concerned about the price falling below the current amount of drawn funds.
3) Capital constraints due to increased origination volume.
Regardless of the reason, most offerings are experiencing a significant amount of interest with above average bid participation. Fewer offerings coupled with the ongoing appetite for especially clean agency MSRs is resulting in increased interest for increasingly fewer opportunities to buy.
In recognition of stiff competition for fewer MSR packages “Large” transactions which we define as deals containing $1 to $5 plus billion in unpaid principal balance continue to validate our very granular GSA prices. As for smaller offerings, the price/multiple spread is narrowing. Smaller offerings defined as $500 million to $1 billion are being targeted by increasingly higher numbers of “Large” transaction buyers. While not always the economies of scale that they want, evidence shows that certain large buyers with excess capacity will gladly purchase a small deal rather than no deal at all.
The smallest packages categorized as $300 million or less in unpaid principal balance are trading at a robust pace too, but at prices that “on average” range anywhere from 10 to 20 bps lower than the bid prices obtained on larger offerings. In addition to the reduced economies of scale afforded by larger MSR trades, the acquisition cost is one of the reasons that smaller deals can trade at a discount to larger offerings. The legal and due diligence cost that a buyer typically incurs to acquire a portfolio can influence how a firm might bid on a smaller trade. Even so, it is the smaller trades that can often create the largest margins and in a quest for margin, increasingly we see larger buyers bidding on smaller offerings but usually with a more rigid approach to price and term negotiations.
Regardless of size, not all bids are as they might appear on the surface. Differences in prepay protection periods, non-reimbursable advances, non-payment for assets that are 60 or more days delinquent, fee deducts for seriously delinquent MSRs, loan kicks, and possible set-up fees are just a few of the pitfalls that can quickly affect a seller’s net execution price.

Figure 3: Year-to-Date Conv 30-YR 3.50% 2019 GSA Index Source: MIAC Analytics™
MIAC’s MSR Valuation department provides MSR valuation advisory services to over 200 institutions totaling nearly $2 trillion in residential and commercial MSR valuations every month.
Residential MSR Market Update – June 2019
Author
Mike Carnes, Managing Director, MSR Valuations, Capital Markets Group
Mike.Carnes@miacanalytics.com