Over the last month, the MIAC Generic Servicing Assets (GSAs™) Conv_30 Index increased by 1.61% and the GNII_FHA_30 index increased by 0.52%. Conversely, and in observance of benchmark trades, VA assets were down slightly less than 2%.
The decline is a reflection of higher potential losses on stressed and/or lower credit VA and VA IRRL MSRs. In larger GSA cohorts, which are actively traded in the MSR market, the Conv30_3.5_2016 and GNII_FHA30_3.5_2016 cohorts respectively increased by 2.82% and 0.54%. During the month of June, Conv_30 Index OAS’s further tightened to close the month at 607.8 bps for a decrease of 30.3 bps. Likewise, GNII_FHA_30 Index OAS’s tightened to 726.7 bps for a month-over-month decrease of 29.5 bps. Year-to-date Conv_30 Index OAS’s are tighter by a full 188.2 bps and GNII_FHA_30 Index OAS’s are tighter by an impressive 267.3 bps. The tightening is a clear support for what could end up being a record year for MSR brokerage transactions.
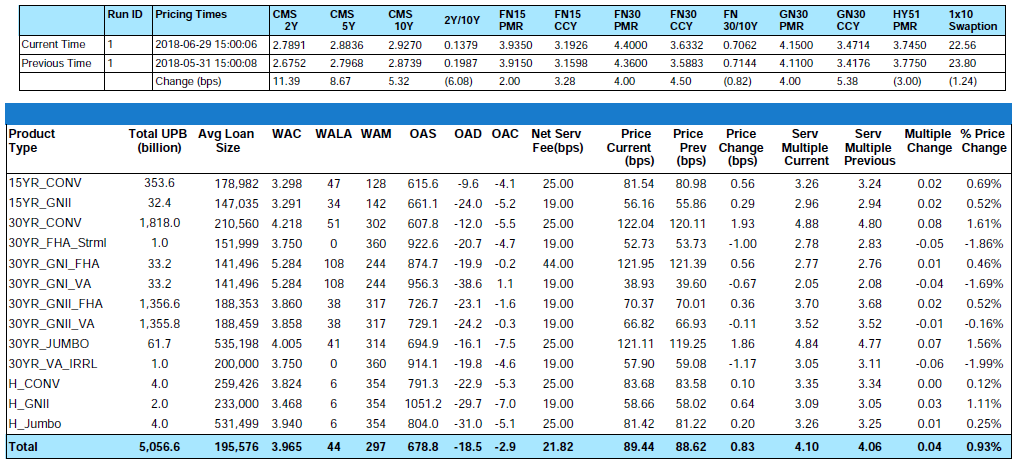
Figure 1: Month-over-Month Price Change by Product Source: MIAC Analytics
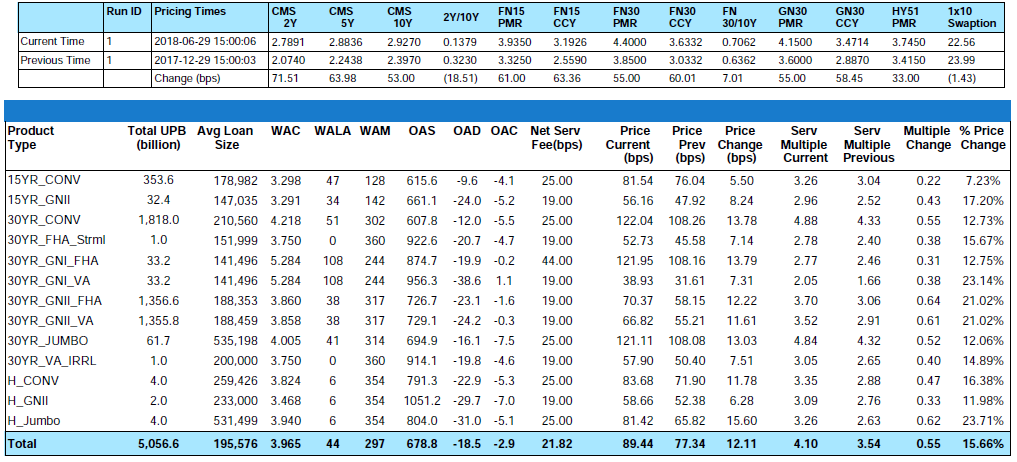
Figure 2: Year-to-Date Price Change by Product Source: MIAC Analytics
From end-of-month May to end-of-month June, primary rates as reported by Bankrate® increased by four (4) basis points. Likewise, during the first 24 days of July, interest rates are currently six (6) basis points higher. At the time of print, this month’s back-up means that year-to-date 30-Yr conventional primary rates are now higher by a full sixty-one (61) basis points. According to the July 6, 2018 MBA Mortgage Finance Forecast, the 30-Year Fixed Rate Mortgage Rate is still projected to end the year at 4.90%. This reflects an additional rise in mortgage rates of 44 basis points.
When primary rates rise and CPR’s begin to level, Servicers increasingly rely on earnings rates as a source for future upside in MSR value. In equivalent fashion with primary mortgage rates, from end-of-month May to end-of-month June, the 5-Yr swap rate, which is a common MSR market benchmark for earnings rates, increased by over eight (8) basis points to end the month at 2.88%. In parallel fashion with primary mortgage rates, quarter-to-date and year-to-date the 5-Yr swap rate respectively ended the period eighteen (18) basis points and sixty-four (64) basis points higher.
Agency and Government Servicing Execution
No two servicing portfolios are alike. Naturally, MSRs are distinguished from one another by Investor, loan program, note rate, and many other defining collateral characteristics but it doesn’t stop there. When attempting to determine what level of execution the market will support for a specific portfolio, increasingly buyers are keenly focused on counterparty and projected losses. Buyers have been paying particular interest to note type, specifically as it relates to VA and VA IRRLS. For Servicers, the combination of borrower credit profile and note type dramatically influence risk and the potential losses associated with each asset. Although remittance, servicing obligations, and cost to service all affect the price that a buyer is willing to bid, when looking at recent buyer behavior it’s clear that even minor differences in credit profile, delinquency ratio, and concentration of special note types dramatically influence “if” or at “what price” a particular portfolio might trade.
Since the beginning of 2018, the spread between pricing on 30 year conventional Fannie Mae products and 30 year FHA Ginnie Mae II products has tightened. However, the spread has only tightened by 1/10th of a multiple and 30 year GNMA products have consistently been at least 1 multiple lower than its 30 year FNMA counterpart. 
Figure 3: 30-YR CONV FNMA – 30-YR FHA GNMA Multiple Spread 2018 GSA Index Source: MIAC Analytics
As is well known, the Federal Housing Administration caters to many first-time and low-to-moderate income homebuyers. Consequently, this can mean lower FICO scores and higher delinquency percentages. On average over the last three years, the seriously delinquent percentage for FHA loans has been 63 percent higher than conventional loans.
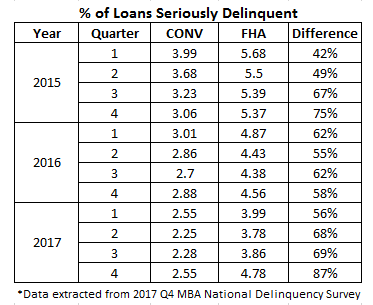
Figure 4: 2017 Q4 MBA National Delinquency Survey – CONV FHA Source: MBA
In last month’s market update we discussed the non-bank liquidity issues (related to GNMA servicing) and subsequent advance requirements once a loan goes delinquent. Since higher delinquency rates often result in higher advance requirements, the more delinquent a portfolio becomes, the less attractive it becomes for most Servicers. Incremental to any advance requirements, the cost of servicing loans that are delinquent or in foreclosure is greater than the cost to service performing loans. Due in part to “potentially” lost interest, the cost to service nonperforming FHA loans can be three times the cost to service a nonperforming GSE mortgage, which further depresses the potential income from FHA servicing. VA MSRs can pose a different type of risk. Unlike the FHA program where the FHA is normally responsible for most non-administrative losses, the maximum VA guaranty is 25 percent of the loan amount, up to the county loan limit, with a minimum guaranty of $36,000. This can make the lender responsible for any loss above the VA guaranty. The VA allows 100 percent LTV financing, which increases the risk that the VA guaranty will not be enough to cover losses in the case of default. This risk can be further expounded with VA IRRLS whereby numerous instances of refinancing can result in originators unknowingly originating MSRs with LTV’s in excess of 100%. Although over the past three years the average percentage of seriously delinquent VA loans was 47 percent less than FHA, the risk posed by the difference in guaranty can be a real cause of concern for buyers and can dramatically influence the price that one might be willing to pay for delinquent and/or lower credit quality VA MSRs.

Figure 5: 2017 Q4 MBA National Delinquency Survey – FHA VA Source: MBA
While VA loans tend to have better overall credit characteristics and performance statistics than FHA loans, from a servicing perspective, the greater risk associated with the smaller loan guaranty can outweigh any benefit from better performance. Despite the continually improved performance, some Servicers are still hesitant to take on potential losses in the event of default. Although the seriously delinquent percentage for VA loans is currently low, following the financial crisis the seriously delinquent percentage of VA loans rose as high as 5.42% at the end of Q4 2009.
With the future state of the economy and VA default rates unknown, Servicers will most likely continue to balk at paying up for lower credit profile product of any kind, but especially for at-risk VA product. Due to potential losses, all MSRs will continue to be hampered by the presence of less than pristine products.
Recent “large” transactions which we define as deals containing $1 to $5 plus billion in unpaid principal balance have validated our very granular GSA prices. As for smaller offerings, the price/multiple spread is narrowing. Smaller offerings, defined as $500 million to $1 billion, are increasingly becoming the target of some larger buyers who have decided they’d rather not compete at the levels currently being offered for some of the largest offerings. Whether the transaction is large or small, one certainty is that most buyers are increasingly targeting pristine portfolios from well-capitalized sellers. While each buyer has their own definition of “thinly” capitalized, the sellers most apt to incur a price adjustment and/or fewer bids are those firms with a net worth less than $10 million. As noteworthy, buyers are increasingly ramping up their counterparty due diligence efforts pre-bid submission as opposed to post-bid submission. While numerous buyers are still content submitting an offer based on a future “satisfactory” review of 2-3 years of audited and most recent unaudited financial statements, a handful of buyers are beginning to request financials prior to bid submission. Should the combination of net worth and a firm’s financials raise any red flags, buyers are more apt to walk away before opposed to after bid submission.
The smallest packages categorized as $300 million or less in unpaid principal balance are trading at a robust pace too but at prices that “on average” range anywhere from 10 to 20 basis points lower than the bid prices obtained on larger offerings.
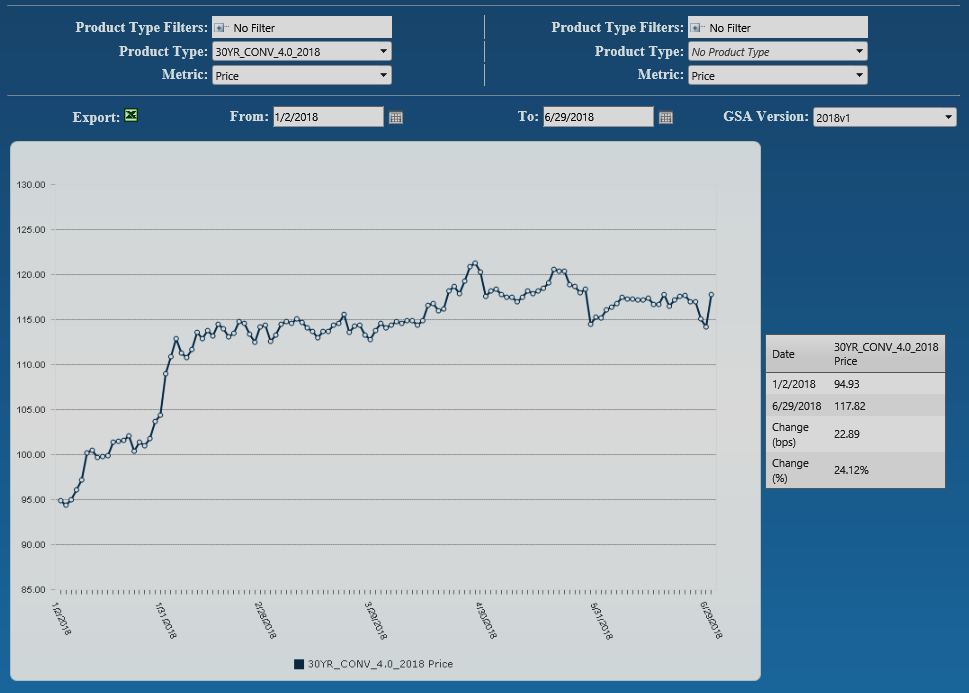
Figure 6: Year-to-Date Conv 30-YR 4.00% 2018 GSA Index Source: MIAC Analytics
MIAC’s MSR Valuation department provides MSR valuation advisory services to over 200 institutions totaling nearly $2 trillion in residential and commercial MSR valuations every month. Learn about MIAC’s industry-leading valuation, brokerage, and/or GSA benchmarking, and please reach out to your MIAC representative for more information.
Residential MSR Market Update – July 2018
Author
Mike Carnes, Managing Director, MSR Valuations, Capital Markets Group
Mike.Carnes@miacanalytics.com
Contributing Author
Nicholas Manolis, Analyst, MSR Valuations, Capital Markets Group
Nicholas.Manolis@miacanalytics.com