Month-over-Month
From end-of-month December to end-of-month January, the MIAC Generic Servicing Assets (GSAs™) Conv_30 Index decreased by 5.22%, and the GNII_FHA_30 Index decreased by 7.70%.
In larger GSA cohorts, which are actively traded in the MSR market, the Conv30_3.5_2018 cohort decreased by 5.63%, and the GNII_FHA30_3.5_2018 cohort decreased by 4.97%. During the month of January, Conv_30 Index OAS’s widened to close the month at 839.7 bps, for an increase of 13.3 bps. The GNII_FHA_30 Index OAS’s tightened to 1,020.6 bps, for a month-over-month decrease of 7.0 bps.
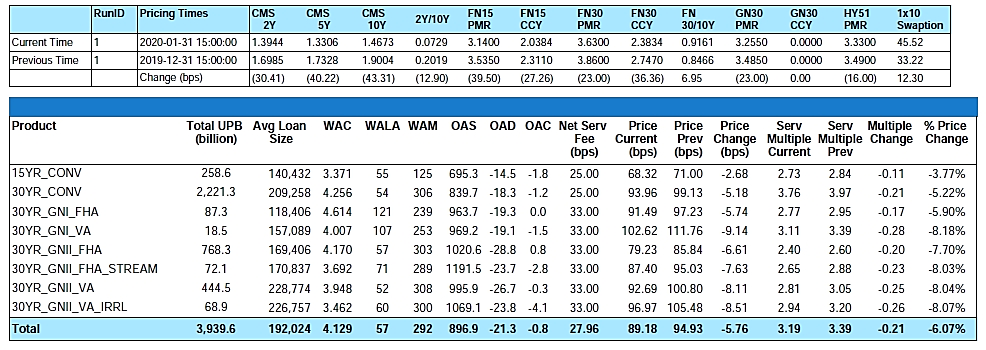
Figure 1: Month-over-Month Pricing Change by Product Source: MIAC Analytics™
From end-of-month December to end-of-month January, MIAC’s Primary Mortgage Rate decreased by twenty-three (23) bps to 3.63%. The impetus for the drop was an uncertain economic outlook brought on by escalating Coronavirus fears which resulted in the 10-year treasury yield falling 37 bps from 1.88% to 1.51% during the month of January.
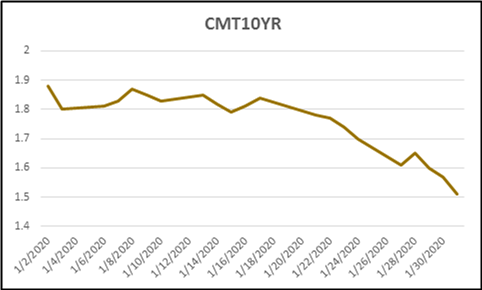
Figure 2: 10 Year Constant Maturity Treasury (CMT) Source: MIAC Analytics™
The interest rate volatility that has been present since the start of the New Year emphasizes the importance of rate benchmarking for not only primary rates but also economic rates. Prepayment speeds are the largest driver of MSR value, and the primary rates used to model and project those speeds are extremely important. If the primary rate used is too high as compared to the market rate than projected speeds will be understated leading to an overstated value, and vice versa.
Concerning economic rates, note that MIAC will be transitioning from a Libor/Swap forward rates and OAS Discounting process to UST forward rates and OAS Discounting process. This topic and the reasons for that change will be discussed in greater detail in future articles.
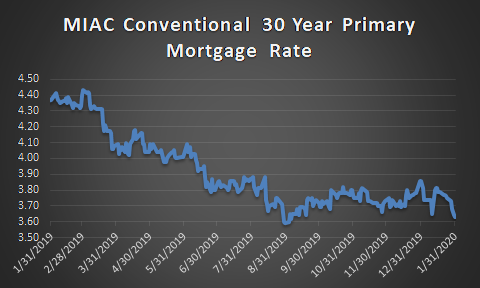
Figure 3: Conventional 30 Year Primary Mortgage Rate Source: MIAC Analytics™
Did anyone say, “Natural Hedge”? While lower rates are certainly detrimental to MSR values, at least borrowing is in strong demand. Like in 2019, the housing market is poised to benefit from a positive demographic force better referred to as Millennials. The Millennial cohort is currently the largest age group in the US and despite competing forces, such as outstanding student loans, it will help to drive increasing demand for owner-occupied housing. Greater housing demand coupled with the current rate environment could result in back to back years of $2 trillion or more of mortgage originations.
Prepayment News
In January we experienced a 23-bps reduction in primary mortgage rate but that was only after a 13-bps increase in the month of December. Considering what can be a 45-day lag between application and actual payoff, January Conventional 30-year agency MBS prepayments (albeit short-lived) took full advantage. December’s rate back-up coupled with housing seasonality joined forces to produce a reduction in Conventional 30-year agency MBS prepayments from 17% in December to 15% in January. As with previous months, Ginnie Mae prepayments remain significantly faster than conventionals with GN-II 2019 vintage 4.0% coupons at a 9 WALA prepaying at a 52% CPR vs. a 26% CPR for similar coupon and vintage Fannie Mae MBS cohorts. Due to high and volatile Ginnie Mae prepayments, valuations for the Ginnie Mae sector are flirting with their lowest levels in many years. With rates expected to stay low, we expect the challenging prepayment pattern to persist going forward.
Considering the Coronavirus concerns and its impact on mortgage rates, refinance potential has increased significantly in recent weeks with 30-year mortgage rates nearing multi-year lows and the MBS mortgage refinance application at its highest level since June 2013. Based on this as well as improved housing seasonals and higher business day count, industry expectations are that March prepays will increase by 20% to 30% above January levels.
Prepayment News Possible Capital/Liquidity Hike for Nonbank Servicers
A recent proposal by the Federal Housing Finance Agency (FHFA) has been sending shockwaves across the industry but especially for nonbanks. As proposed the plan would increase the minimum capital and liquidity requirements for nonbank sellers/servicers but would treat Ginnie Mae mortgages differently from the GSE’s. At present Fannie Mae, Freddie Mac, and Ginnie assets are all treated the same which is nonbank seller/servicers are required to have a minimum net worth of $2.5 million-plus 25 bps for the unpaid principal balance (UPB) of all single-family mortgages. Under the newly proposed FHFA rule, nonbank seller/servicers would have to hold $2.5 million-plus 35 bps for their Ginnie mortgages. Similarly, there would be a divergence in how liquidity requirements are applied. The liquid assets that nonbank seller/servicers are required to hold would rise from 3.5 bps to 4.0 bps of Enterprise servicing UPB plus 10 bps of Ginnie Mae servicing UPB. Of equal concern, under the proposal, unused portions of lines of credit from finance facilities would be disallowed as a mechanism for being able to meet the required liquidity standards.
Higher net worth and liquidity requirements are consistent with the more capital-intensive work some Ginnie Mae servicers perform but keep this in mind. While designed for the possibility of adverse or severely adverse market conditions, not all Ginnie Mae servicing has weaker credit profiles and whether base, adverse or severely adverse market conditions, not all Ginnie Mae servicing will default at the same propensity.” For purposes of valuation, risk management, and scenario analysis, having the ability to properly measure credit outcomes is key. For reference, see MIAC’s monthly Research Insights – October 2019 which provides additional insight into topics including the importance of understanding credit transitions and the potential performance disparity between FHA and VA. When it comes to Ginnie Mae credit models, the sector is a very important credit attribute readily available to clients, and it should be used when assessing credit risk. Sadly, most competing Ginnie Mae credit models ignore the impact of the sector and cannot be relied upon for accurate projections.
MSR Transaction Activity
As is often the case, a new year can mean refreshed budgets and sellers looking to take advantage of those budgets. This year was no exception with numerous notable trades hitting the market in January of which most seem poised to close. The idea of selling after a rate rally may not seem all that appealing but for those who might lack a robust or profitable recapture platform, selling remains a viable option. While execution levels may be slightly lower, if rates and prepayments continue their current trajectory, sellers may benefit from selling in a low rate environment as opposed to waiting until prepays wreak havoc on one’s portfolio leaving far fewer legacy MSRs to sell in the future. This is especially true considering the potential benefit sellers stand to gain from buyers who may be willing to pay a premium for the opportunity to recapture.
Looking back to the 4th Quarter of 2019, $162.46 billion of Fannie Mae, Freddie Mac, and Ginnie Mae MSRs changed hands. That brought the full-year 2019 Bulk and Mergers & Acquisition related transfers to $635.27 billion which is higher by roughly 3.8% over 2018.
“Large” transactions, which we define as deals containing $1 – $5+ billion in unpaid principal balance, continue to validate our very granular GSA prices. As for smaller offerings, the price/multiple spreads initially tightened, but depending on the trade and amount of buy-side interest is now showing some signs of widening. This is largely due to the previously referenced differences in the amount of recapture benefit being included in a buyer’s offering price. We have witnessed trades where the value attributed to recapture is zero bps, and others when the spread has been 12 bps (and a lot in between).
The smallest packages, categorized as $300 million or less in unpaid principal balance, are trading but at prices that “on average” range anywhere from 10 – 20 bps lower than the bid prices obtained on larger offerings. In addition to the increased economies of scale afforded by larger MSR trades, the acquisition cost is one of the reasons that smaller deals can trade at a discount to larger offerings. The legal and due diligence costs that a buyer typically incurs to acquire a portfolio, can influence how a firm might bid on a smaller trade. Even so, it is the smaller trades that can often create the largest margins. And in a quest for margin, increasingly we see larger buyers bidding on smaller offerings but usually with a more rigid approach to price and term negotiations.
Regardless of size, not all bids are as they might appear on the surface. Differences in prepay protection periods, non-reimbursable advances, non-payment for assets that are 60+ days delinquent, fee deductions for seriously delinquent MSRs, loan kicks, seller non-solicitation requirements, and possible set-up fees are just a few of the pitfalls that can quickly affect a seller’s net execution price.
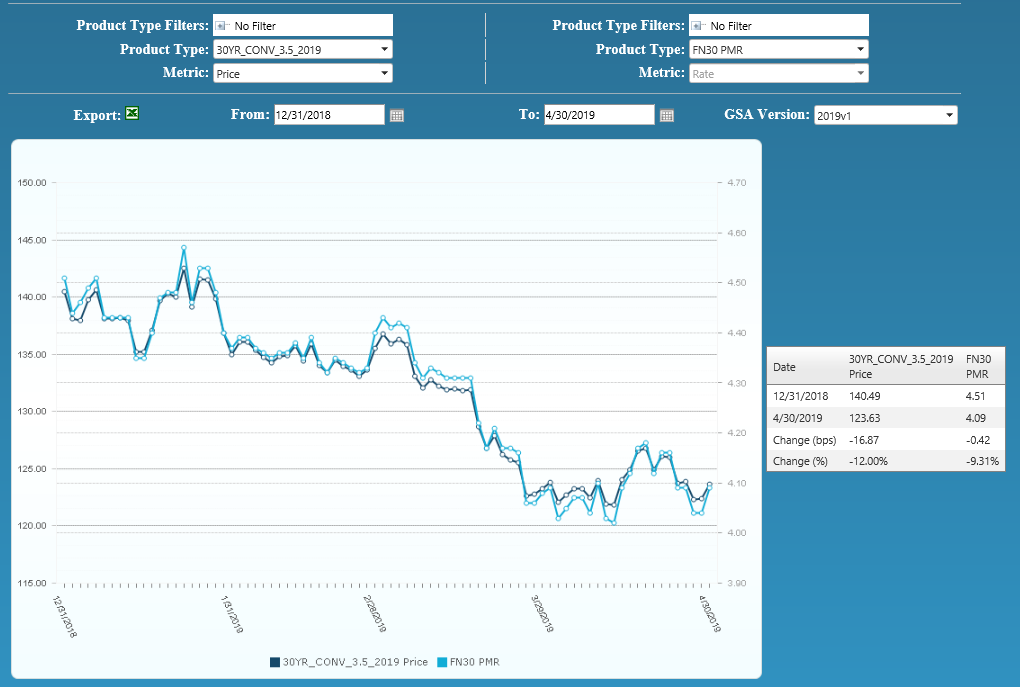
Figure 4: Year-to-Date Conv 30-YR 3.50% 2019 GSA Index Source: MIAC Analytics™
MIAC’s MSR Valuation department provides MSR valuation advisory services to over 200 institutions totaling nearly $2 trillion in residential and commercial MSR valuations every month.
.
Residential MSR Market Update – January 2020
Author
Mike Carnes, Managing Director, MSR Valuations Group
Co-Author
Nicholas Manolis, Vice President, MSR Valuations Group
Nicholas.Manolis@miacanalytics.com