Executive Summary
When accounting for MSR’s, “fair value” compliance with the FASB’s ASC 820 standard is the objective. Because MIAC’s Generic Servicing Assets (GSAs™) track fair value at a granular level, MIAC can utilize bulk package transaction pricing information to better inform MIAC’s price discovery process. Given the current number of observed trades and depending on one’s MSR portfolio, MIAC has a considerable amount observed empirical pricing data to validate and defend our MSR fair market values.
Mortgage firms not already leveraging MIAC’s GSA pricing and MIAC’s MSR price discovery process frequently discover that some or at least certain segments of their MSR portfolio have been significantly overvalued. All too often, firms come to this discovery the hard way, through a failed auction. Don’t be one of those firms! Under ASC 820, “Fair Market” value is the price that would be received to sell an asset in an orderly transaction between market participants at the measurement date. In an orderly established market, any attempt to book or receive levels other than market supported values is strongly discouraged and should be avoided for reasons other than determining one’s own economic benefit. MIAC’s GSA’s are regularly calibrated to observed trades and can be used as a reliable benchmark from a firm that provides MSR valuation advisory services to over 200 institutions totaling nearly $2 trillion in residential and commercial MSR valuations every month.
The Details
Over the last month, the MIAC GSA Conv_30 Index increased by 1. 1.33% and the GNII_FHA_30 index increased by 2.00%. In larger GSA cohorts, which are actively traded in the MSR market, the Conv30_3.5_2016 and GNII_FHA30_3.5_2016 cohorts respectively increased by 2.24% and 1.84%. During the month of July, Conv_30 Index OAS’s further tightened to close the month at 607.8 bps for a decrease of 16.7 bps. Likewise, GNII_FHA_30 Index OAS’s tightened to 714.0 bps for a month-over-month decrease of 12.7 bps. Year-to-date Conv_30 Index OAS’s are tighter by a full 204.9 bps and GNII_FHA_30 Index OAS’s are tighter by an impressive 280.0 bps.
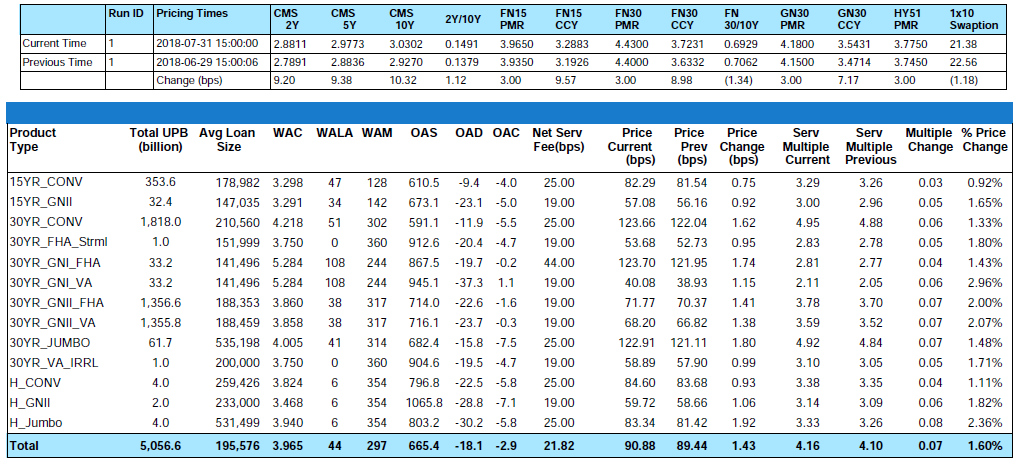
Figure 1: Month-over-Month Price Change by Product Source: MIAC Analytics

Figure 2: Year-to-Date Price Change by Product Source: MIAC Analytics
From end-of-month June to end-of-month July, primary rates as reported by Bankrate® increased by three (3) basis points. August, however, is showing some volatility and during the first 23 days of the month are currently two (2) basis points lower. At the time of print, this month’s back-up means that year-to-date 30-Yr conventional primary rates are still higher by a full fifty-six (56) basis points but be advised that the MBA did recently update their projected end-of-year 30-Year Fixed Rate Mortgage Rate from 4.90% to what is now 4.80%.
When primary rates rise and CPR’s begin to level, Servicers increasingly rely on earnings rates as a source for future upside in MSR value and this month was no exception. From end-of-month June to end-of-month July, the 5-Yr swap rate, which is a common MSR market benchmark for earnings rates, increased by approximately ten (10) basis points to end the month at 2.98%. Also, in parallel fashion with primary mortgage rates, year-to-date the 5-Yr swap rate ended the period a whopping seventy-three (73) basis points higher.
FEMA Declared Disaster Areas
Fannie Mae has updated its Servicing Guide with Announcement SVC-2018-05, which includes clarification on the policy of inspecting and preserving properties impacted by disasters, an increase of the maximum reimbursement limit for insured loss repair inspections, and the MI Factor. The announcement comes as we approach the peak of hurricane season, the period of time when hurricanes Harvey, Irma, and Maria made landfall in 2017. Last year was the most expensive hurricane season in U.S. history with the total cost of damage estimated at around $200 billion. Although predictions for 2018 favor a below-normal hurricane season, it is important that firm’s flag and monitor assets that reside in hurricane-related FEMA declared disaster areas as the peak of the season approaches.
With at least 13 large fires spread across California throughout August, hurricanes are not the only type of disaster that needs to be monitored. These fires have threatened over 16,000 homes, led to the evacuation of nearly 25,000 residents, and have already caused billions of dollars in damage. The fires are also causing insurance companies to reassess how they gauge wildfire risk in California. This reassessment could cause an increase the percentage of homes currently rated as a high or very high risk. As a result of this reassessment, some homeowners may be notified by their insurance company of non-renewal, which allows 45 days to find replacement coverage. If the home is located in a high-risk zone, finding replacement coverage might be difficult and the replacement coverage would likely come with a higher premium. This additional cost could put a strain on the ability of some homeowners to adjust to their new payments. Similar to other natural disasters, fires do not just destroy homes in their path, but also destroy local businesses by forcing closures, displacing employees, and slowing business.
Natural disasters can cause substantial damage to both the homes and income streams of borrowers located in disaster areas. Due to the effect natural disasters can have on borrowers, and therefore loan performance, MIAC constantly monitors and flags assets located in FEMA disaster areas.
In other MBA News…
On July 24th the MBA in a letter to the federal regulatory agencies (including FDIC, OCC, and Board of Governors of the Federal Reserve System) requested the agencies ramp up their efforts to provide final rules stemming from their proposal to simplify certain aspects of their capital rules. While the original letter focused on two specific areas, the one most germane to the topic at hand is the Agencies proposal to increase the cap on the amount of mortgage servicing assets that can be included in Tier 1 capital from 10% to 25% and eliminate the 15% cap on the aggregate amount of MSAs, deferred tax assets, and certain other assets that can be included in Tier 1 capital.
“While MBA supports the Agencies’ efforts to simplify the rules in order to reduce unnecessary complexity and eliminate provisions that create unnecessary burdens and hinder financial stability and economic growth, it is important for the industry to have final rules issued as soon as possible,” wrote MBA Senior Vice President of Public Policy and Industry Relations Stephen O’Connor. “Therefore, we respectfully urge the Agencies to finalize the provisions in the Proposal relating to the regulatory deduction rules promptly. The lack of final rules continues to create capital planning challenges for many banks due to lack of certainty on several issues addressed in the Proposal.”
MSR Transaction Activity
As anticipated, the volume of MSR transfers gained momentum in the 2nd Quarter of 2018. Up 6.4% from the 1st quarter of 2018, nearly $130 billion changed hands during the 2nd quarter. Despite the volume, according to Inside Mortgage Finance, all of the top 5 servicers reported slight declines in their MSR portfolios during the 2nd quarter. Collectively, the top five servicers reported a total of $3.661 trillion in MSR’s at the end of the 2nd quarter which is a 0.7 percent decline from the 1st Quarter of 2018.
Recent “large” transactions which we define as deals containing $1 to $5 plus billion in unpaid principal balance have validated our very granular GSA prices. As for smaller offerings, the price/multiple spread is narrowing. Smaller offerings, defined as $500 million to $1 billion, are increasingly becoming the target of some larger buyers who have decided they’d rather not compete at the levels currently being offered for some of the largest offerings. Whether the transaction is large or small, one certainty is that most buyers are increasingly targeting pristine portfolios from well-capitalized sellers. While each buyer has their own definition of “thinly” capitalized, the sellers most apt to incur a price adjustment and/or fewer bids are those firms with a net worth less than $10 million. As noteworthy, buyers are increasingly ramping up their counterparty due diligence efforts, pre-bid submission, as opposed to post-bid submission. While numerous buyers are still content submitting an offer based on a future “satisfactory” review of 2-3 years of audited and most recent unaudited financial statements, a handful of buyers are beginning to request financials prior to bid submission. Should the combination of net worth and a firm’s financials raise any red flags, buyers are more apt to walk away before opposed to after bid submission.
The smallest packages categorized as $300 million or less in unpaid principal balance are trading at a robust pace too but at prices that “on average” range anywhere from 10 to 20 basis points lower than the bid prices obtained on larger offerings.

Figure 3: Year-to-Date Conv 30-YR 4.00% 2018 GSA Index Source: MIAC Analytics
MIAC’s MSR Valuation department provides MSR valuation advisory services to over 200 institutions totaling nearly $2 trillion in residential and commercial MSR valuations every month. Learn about MIAC’s industry-leading valuation, brokerage, and/or GSA benchmarking, and please reach out to your MIAC representative for more information.
Residential MSR Market Update – July 2018
Author
Mike Carnes, Managing Director, MSR Valuations, Capital Markets Group
Mike.Carnes@miacanalytics.com
Contributing Author
Nicholas Manolis, Analyst, MSR Valuations, Capital Markets Group
Nicholas.Manolis@miacanalytics.com